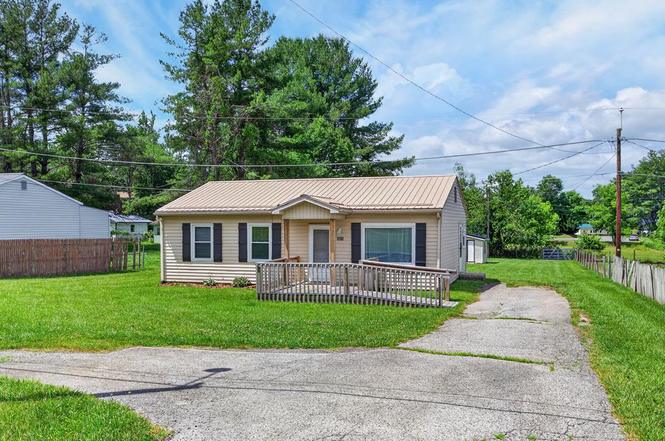
321 Training Center Rd
Woodlawn, VA 24381
$150,000D-
3 bd · 1.0 ba ·
900 sqft ·
Built 1967
· SingleFamily
· Active
· 2 DOM
Cashflow @ list (25.0% down · 7.5%)
Estimated rent
$948/mo
Mortgage (P&I)
−$787
Tax + insurance
−$100
HOA
−$0
Vac / Maint / Mgmt
−$199
Net cashflow
$-138/mo
Annual
$-1,658/yr
Cap rate
5.19%
Cash-on-cash
-3.95%
DSCR
0.82
1% rule
0.63%
Cash to close
$42,000
Investor read
- This is a 3-bed/1.0-bath single-family listed at $150k.
- At list price, monthly cash flow is $-138 ($-2k/yr) — negative.
- To cash-flow at today's rent, offer at most $126k (16.3% below list).
- To meet the 1% rule (rent ≥ 1% of price), the offer needs to be $95k (36.8% below list).
- Only 2 days on market — expect competitive offers; lowballing is unlikely to land.
- Recommended offer: $95k (36.8% below list) — sets the bar for 1% rule.
- In year one you build about $8k of equity ($1k loan paydown + $7k appreciation (4.5% local appreciation)).
- Location reads 73/100 on livability (#164 in VA) — a middle-class / working-renter tenant base. Strengths: commute A+, employment A, housing A-; Watch: amenities F.
- Carroll County Public School District (rural): math 60% / reading 70% proficiency, ranked #46 of 131 in VA (top 35%) — acceptable for families but not a draw, mixed tenant base, ~2y average lease.
- Zoned schools: Laurel Elementary (math 62% / reading 62%, grade B, #480 of 1,108 statewide, top 46%, 225 students, 87% FRL); Carroll County Middle (math 54% / reading 72%, grade B+, #134 of 342 statewide, top 40%, 756 students, 84% FRL); Carroll County High (math 64% / reading 67%, grade B, #204 of 319 statewide, top 65%, 1,069 students, 81% FRL) — zoned schools average 84% FRL vs 48% district-wide (36 pts higher); higher-poverty schools than district average — tighter screening recommended.
- Market conditions: 24 active listings in the ZIP; 80 units permitted in Carroll County in 2024 (0 in 5+ unit buildings).
- Carroll County population projected at -18% by 2050 — secular population decline; favor cash flow + early exit over multi-decade hold.
- 2 sale attempts since 4y ago with the ask held roughly flat each time — persistent listings suggest the price (not the market) is what's stuck; bring a comps-based counter.
- By year 5, paydown + projected appreciation supports a ~$34k cash-out refi (75% LTV) — recoverable capital for the next deal without selling this one.
- Cap rate 5.2% vs local median 3.3% in Woodlawn — top-decile yield for the area; either an underpriced asset or a hidden risk that comps aren't pricing in. Stress-test before assuming the spread holds.
Questions for listing agent
- What do current leases actually rent for vs. the listed asking? Can we see a recent rent roll and the last 12 months of T-12 income?
- Built in 1967 — when were the roof, HVAC, electrical panel, plumbing, and water heater last replaced?
- Is there a deadline driving the sale (1031 exchange, divorce, estate, relocation)? That informs how much negotiation room exists.
- Schools are F-rated, which usually means shorter tenancies and higher turnover. Who's the typical renter profile here, and what's been the actual vacancy rate?
- The area grade is low — what's the realistic commute time and amenity access for the typical tenant pool here? Any planned neighborhood developments (good or bad) we should know about?
- What's the average days-on-market for RENTAL listings here right now (not sales)? A rising rental-DOM trend means longer vacancies and softer asking-rent achievability than the comps imply.
- What's the recent tenant-quality profile in this submarket — average credit score on applications, eviction rate, late-payment / NSF rate, and stable-employment percentage? A property-management company in the area should have these aggregated.
- How much new for-sale + rental construction is in the pipeline within 1–3 miles? Heavy new supply typically softens prices + rents 12–24 months out; constrained supply supports both.
CashFlowRE · CFR-A02TX1EC4NM2AT
· Data 1 day ago
cashflowre.app · 2026-05-29