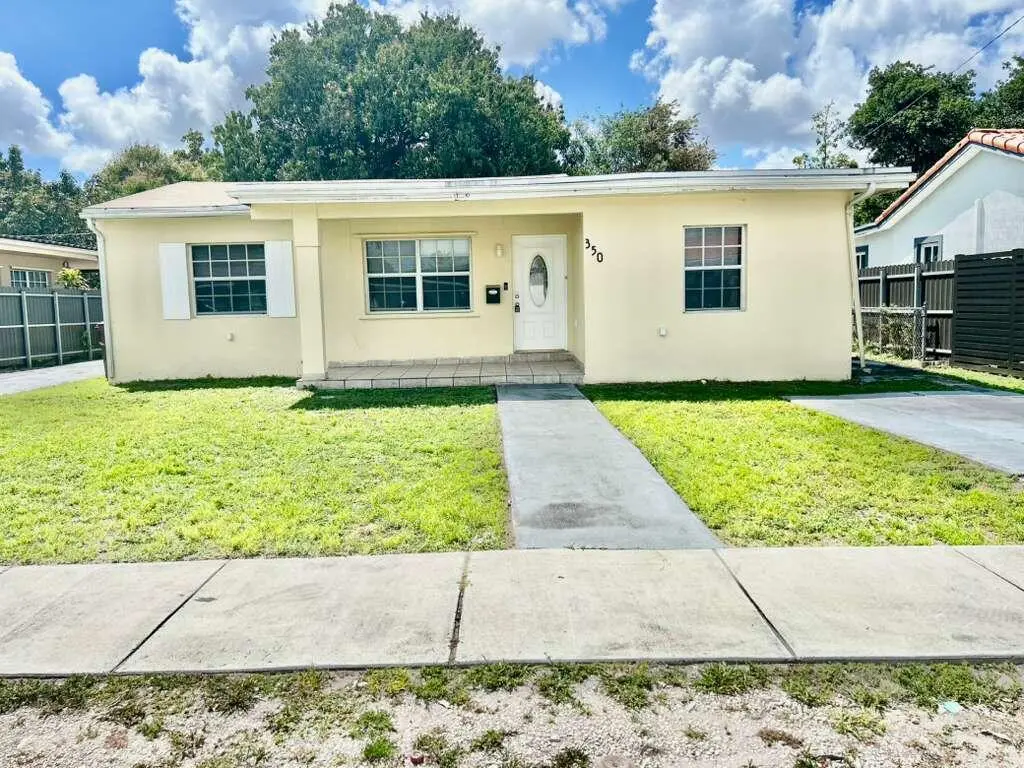
350 E 58th St
Hialeah, FL 33013
$434,900C+
4 bd · 3.0 ba ·
1,891 sqft ·
Built 1949
· SingleFamily
· Pending
· 2 DOM
Cashflow @ list (25.0% down · 7.5%)
Estimated rent
$4,803/mo
Mortgage (P&I)
−$2,281
Tax + insurance
−$912
HOA
−$0
Vac / Maint / Mgmt
−$1,009
Net cashflow
$602/mo
Annual
$7,219/yr
Cap rate
7.95%
Cash-on-cash
5.93%
DSCR
1.26
1% rule
1.10%
Cash to close
$121,772
Investor read
- This is a 4-bed/3.0-bath single-family listed at $435k.
- At list price, monthly cash flow is $602 ($7k/yr) — positive.
- The deal already cash-flows at list — no discount required.
- Meets the 1% rule at list price ($5k rent vs $435k).
- Only 2 days on market — expect competitive offers; lowballing is unlikely to land.
- Local home prices are declining (-3.0%/yr); year-one equity from $3k of loan paydown is wiped out by about $13k of value loss. Plan a longer hold.
- Location reads 74/100 on livability (#288 in FL, #4,774 nationally) — a middle-class / working-renter tenant base. Strengths: commute A+, health & safety A+; Watch: amenities F, employment D-.
- Miami-Dade (suburban): math 45% / reading 54% proficiency, ranked #40 of 73 in FL (top 55%) — families likely to look elsewhere, expect single-tenant / working-renter base with shorter leases; 64% free/reduced lunch — lower-income household profile, screen leases tightly.
- Zoned schools: Palm Springs Elementary School (math 39% / reading 52%, grade D-, #1,247 of 2,144 statewide, top 59%, 559 students, 58% FRL); Hialeah Middle School (math 30% / reading 42%, grade F, #410 of 571 statewide, top 72%, 878 students, 68% FRL); Hialeah Senior High School (math 16% / reading 37%, grade F, #489 of 667 statewide, top 74%, 1,732 students, 67% FRL) — zoned schools at 65% FRL track the district average.
- Zoned-school proficiency averages 36% at this address vs 50% district-wide (-14 pts) — the specific schools serving this property underperform the Miami-Dade average; the district grade overstates school quality for this exact location.
- Watch-outs: built in 1949 — expect roof / HVAC / electrical / plumbing capex.
- Market conditions: Rents soft (-0.1%/yr); 111 active listings in the ZIP; 10,051 units permitted in Miami-Dade County in 2024 (7,758 in 5+ unit buildings).
- Miami-Dade County population projected at +28% by 2050 — long-run rental-demand tailwind backs the buy-and-hold thesis.
- 2 sale attempts with the ask held roughly flat each time — persistent listings suggest the price (not the market) is what's stuck; bring a comps-based counter.
- Climate carrying-cost: severe wind risk, 99% chance of damaging wind over 30y; extreme-heat days projected 7→29/yr by 2055 (HVAC capex compounding) — expect insurance premiums to compound above CPI over the hold.
- Cap rate 8.0% vs local median 3.5% in Hialeah — top-decile yield for the area; either an underpriced asset or a hidden risk that comps aren't pricing in. Stress-test before assuming the spread holds.
- At $4,803/mo this rent would consume 95% of the median local household income ($61k/yr) (locally 1352% of renters already pay >50% of income on rent) — very limited rent-growth headroom before tenants either downsize or default.
Questions for listing agent
- Built in 1949 — when were the roof, HVAC, electrical panel, plumbing, and water heater last replaced?
- Is there a deadline driving the sale (1031 exchange, divorce, estate, relocation)? That informs how much negotiation room exists.
- What's the average days-on-market for RENTAL listings here right now (not sales)? A rising rental-DOM trend means longer vacancies and softer asking-rent achievability than the comps imply.
- What's the recent tenant-quality profile in this submarket — average credit score on applications, eviction rate, late-payment / NSF rate, and stable-employment percentage? A property-management company in the area should have these aggregated.
- How much new for-sale + rental construction is in the pipeline within 1–3 miles? Heavy new supply typically softens prices + rents 12–24 months out; constrained supply supports both.
CashFlowRE · CFR-A1E0KJ7W6RK7MN
· Data 4 weeks ago
cashflowre.app · 2026-05-29