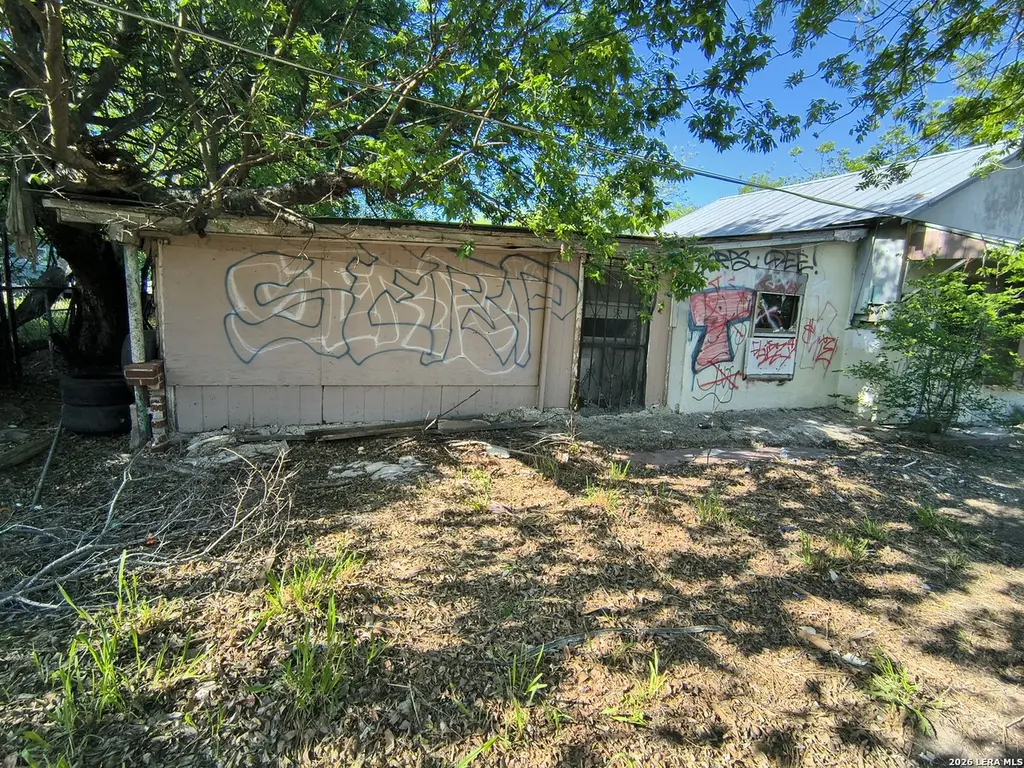
1119 King Ave
San Antonio, TX 78211
$65,000B
2 bd · 1.0 ba ·
1,632 sqft ·
Built 1952
· SingleFamily
· Active
· 26 DOM
Cashflow @ list (25.0% down · 7.5%)
Estimated rent
$1,313/mo
Mortgage (P&I)
−$341
Tax + insurance
−$298
HOA
−$0
Vac / Maint / Mgmt
−$276
Net cashflow
$398/mo
Annual
$4,781/yr
Cap rate
13.65%
Cash-on-cash
26.27%
DSCR
2.17
1% rule
2.02%
Cash to close
$18,200
Investor read
- This is a 2-bed/1.0-bath single-family listed at $65k.
- At list price, monthly cash flow is $398 ($5k/yr) — positive.
- The deal already cash-flows at list — no discount required.
- Meets the 1% rule at list price ($1k rent vs $65k).
- It's been on market 26 days — a 2% lower offer ($64k) is reasonable based on typical stale-listing flexibility.
- Recommended offer: $64k (1.5% below list) — sets the bar for market timing.
- In year one you build about $157 of equity ($449 loan paydown + $-292 appreciation (-0.5% local appreciation)).
- Location reads 80/100 on livability (#31 in TX, #1,616 nationally) — a professional / high-income tenant draw. Strengths: amenities A+, commute A+, cost of living A+; Watch: crime F.
- South San Antonio ISD (urban): math 13% / reading 20% proficiency, ranked #804 of 826 in TX (top 97%) — low school quality limits family demand, transient renter base, plan for 1-2y turnover.
- Zoned schools: Miguel Carrillo Jr El (math 12% / reading 12%, grade F, #4,207 of 4,322 statewide, top 98%, 277 students, 98% FRL); South San Antonio H S (math 27% / reading 32%, grade F, #1,112 of 1,632 statewide, top 70%, 1,786 students, 93% FRL) — zoned schools average 95% FRL vs 42% district-wide (54 pts higher); higher-poverty schools than district average — tighter screening recommended.
- Watch-outs: property tax is 5.0% of price; built in 1952 — expect roof / HVAC / electrical / plumbing capex.
- Market conditions: 162 active listings in the ZIP; 2 comparable units currently listed for rent nearby; 8,308 units permitted in Bexar County in 2024 (2,506 in 5+ unit buildings).
- Bexar County population projected at +50% by 2050 — long-run rental-demand tailwind backs the buy-and-hold thesis.
- 2 sale attempts since 16y ago with the ask held roughly flat each time — persistent listings suggest the price (not the market) is what's stuck; bring a comps-based counter.
- At projected returns (-0.5% appreciation + 3.0% rent growth), your $18k cash investment doubles in ~4 years — after that, you're playing with house money.
- Climate carrying-cost: severe wind risk, 80% chance of damaging wind over 30y; extreme-heat days projected 7→22/yr by 2055 (HVAC capex compounding) — expect insurance premiums to compound above CPI over the hold.
- Cap rate 13.6% vs local median 3.8% in San Antonio — top-decile yield for the area; either an underpriced asset or a hidden risk that comps aren't pricing in. Stress-test before assuming the spread holds.
Questions for listing agent
- Built in 1952 — when were the roof, HVAC, electrical panel, plumbing, and water heater last replaced?
- Property tax is high relative to price — has the assessment been appealed recently, and will the sale trigger a re-assessment?
- Is there a deadline driving the sale (1031 exchange, divorce, estate, relocation)? That informs how much negotiation room exists.
- Crime grade is F in this area — have there been break-ins, vandalism, or insurance claims at this property in the last 3 years? What carrier currently insures it and at what premium?
- What's the average days-on-market for RENTAL listings here right now (not sales)? A rising rental-DOM trend means longer vacancies and softer asking-rent achievability than the comps imply.
- What's the recent tenant-quality profile in this submarket — average credit score on applications, eviction rate, late-payment / NSF rate, and stable-employment percentage? A property-management company in the area should have these aggregated.
- How much new for-sale + rental construction is in the pipeline within 1–3 miles? Heavy new supply typically softens prices + rents 12–24 months out; constrained supply supports both.
CashFlowRE · CFR-AAAH8H73TWZ3ZZ
· Data 17 h ago
cashflowre.app · 2026-05-29