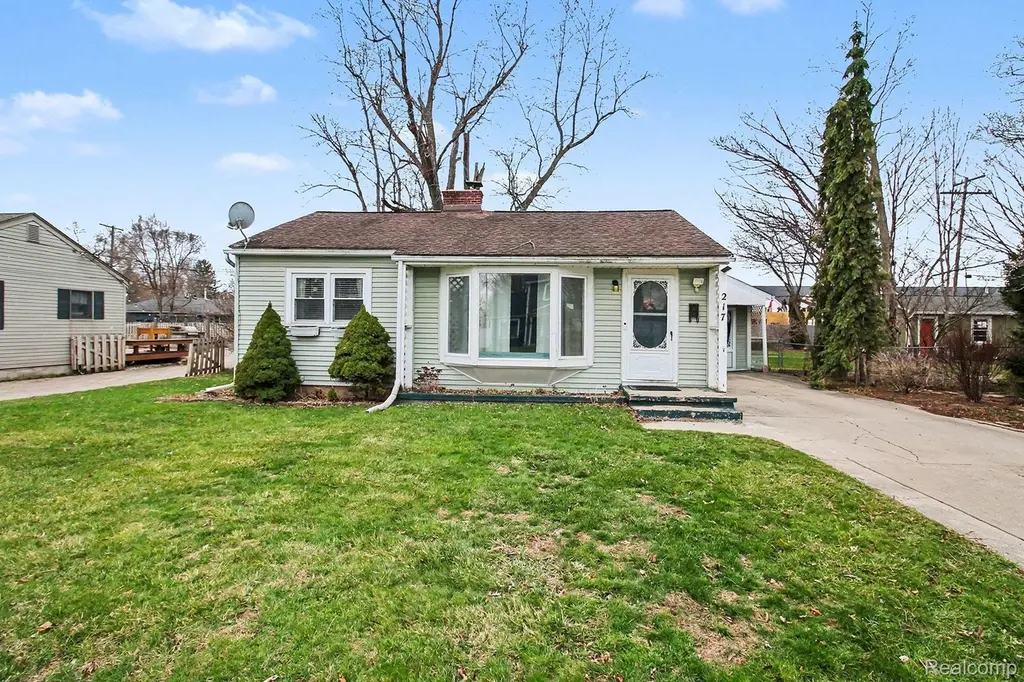
217 N 5th St
Brighton, MI 48116
$335,000D
3 bd · 1.0 ba ·
1,454 sqft ·
Built 1950
· SingleFamily
· Pending
· 33 DOM
Cashflow @ list (25.0% down · 7.5%)
Estimated rent
$2,490/mo
Mortgage (P&I)
−$1,757
Tax + insurance
−$374
HOA
−$0
Vac / Maint / Mgmt
−$523
Net cashflow
$-164/mo
Annual
$-1,967/yr
Cap rate
5.71%
Cash-on-cash
-2.10%
DSCR
0.91
1% rule
0.74%
Cash to close
$93,800
Investor read
- This is a 3-bed/1.0-bath single-family listed at $335k.
- At list price, monthly cash flow is $-164 ($-2k/yr) — negative.
- To cash-flow at today's rent, offer at most $306k (8.6% below list).
- To meet the 1% rule (rent ≥ 1% of price), the offer needs to be $249k (25.7% below list).
- It's been on market 33 days — a 3% lower offer ($325k) is reasonable based on typical stale-listing flexibility.
- Recommended offer: $249k (25.7% below list) — sets the bar for 1% rule.
- Local home prices are declining (-3.0%/yr); year-one equity from $2k of loan paydown is wiped out by about $10k of value loss. Plan a longer hold.
- Location reads 78/100 on livability (#108 in MI, #2,621 nationally) — a middle-class / working-renter tenant base. Strengths: cost of living A+, housing A+, health & safety A+; Watch: amenities F, commute F.
- Brighton Area Schools (suburban): math 59% / reading 69% proficiency, ranked #22 of 540 in MI (top 4%) — acceptable for families but not a draw, mixed tenant base, ~2y average lease; only 10% free/reduced lunch — higher-income household profile.
- Watch-outs: built in 1950 — expect roof / HVAC / electrical / plumbing capex.
- Market conditions: 178 active listings in the ZIP; 7 comparable units currently listed for rent nearby; rentals leasing fast (median 5d on market — plan ~1-2 weeks tenant-placement turnaround); solid renter incomes; 488 units permitted in Livingston County in 2024 (0 in 5+ unit buildings).
- Livingston County population projected at +7% by 2050 — modest demand growth; plan on rents tracking national, not racing it.
- 6 sale attempts since 21y ago with the ask held roughly flat each time — persistent listings suggest the price (not the market) is what's stuck; bring a comps-based counter.
- Current owner paid $129k; list at $335k implies a 160% gain — meaningful room to come down on a strong offer.
- Cap rate 5.7% vs local median 3.2% in Brighton — top-decile yield for the area; either an underpriced asset or a hidden risk that comps aren't pricing in. Stress-test before assuming the spread holds.
Questions for listing agent
- What do current leases actually rent for vs. the listed asking? Can we see a recent rent roll and the last 12 months of T-12 income?
- It's been on market 33 days. Have you received any prior offers? Is the seller open to a 26% concession, seller financing, or rate buy-down credit?
- Built in 1950 — when were the roof, HVAC, electrical panel, plumbing, and water heater last replaced?
- Is there a deadline driving the sale (1031 exchange, divorce, estate, relocation)? That informs how much negotiation room exists.
- Schools are A-rated — typically a magnet for longer-tenancy family renters. What's the average tenant stay here, and is there a school-zone premium baked into asking?
- The area grade is low — what's the realistic commute time and amenity access for the typical tenant pool here? Any planned neighborhood developments (good or bad) we should know about?
- What's the average days-on-market for RENTAL listings here right now (not sales)? A rising rental-DOM trend means longer vacancies and softer asking-rent achievability than the comps imply.
- What's the recent tenant-quality profile in this submarket — average credit score on applications, eviction rate, late-payment / NSF rate, and stable-employment percentage? A property-management company in the area should have these aggregated.
CashFlowRE · CFR-AAD71YBAFMBZ8Q
· Data 3 weeks ago
cashflowre.app · 2026-05-29