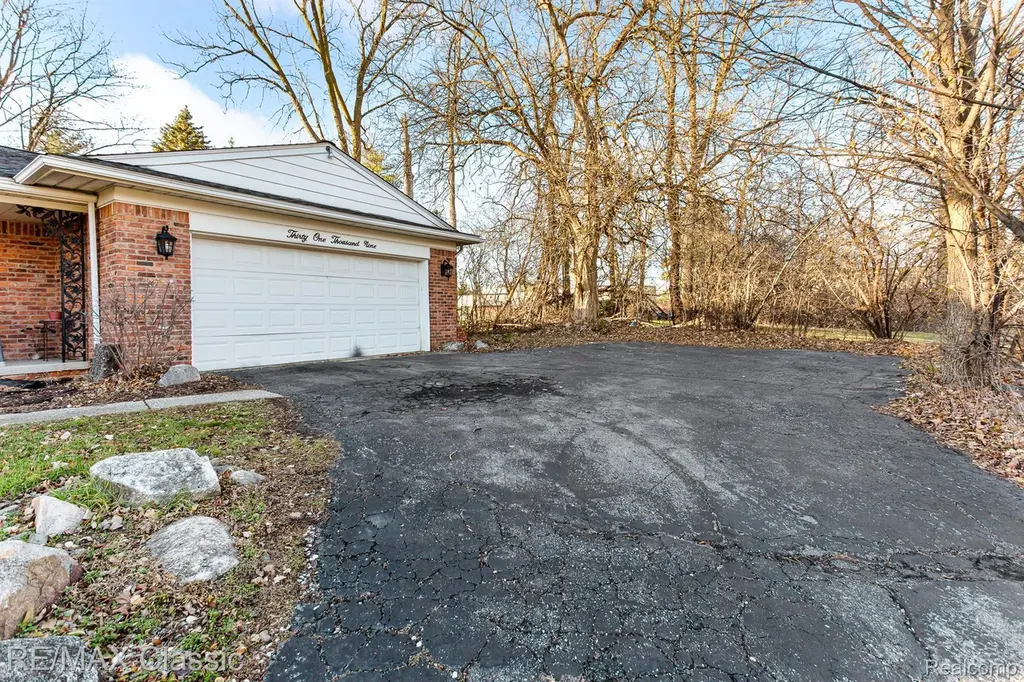
31009 Heritage Hills Dr
Farmington Hills, MI 48331
$314,900D
4 bd · 2.5 ba ·
2,386 sqft ·
Built 1968
· SingleFamily
· Pending
· 39 DOM
Cashflow @ list (25.0% down · 7.5%)
Estimated rent
$2,658/mo
Mortgage (P&I)
−$1,651
Tax + insurance
−$768
HOA
−$29
Vac / Maint / Mgmt
−$558
Net cashflow
$-349/mo
Annual
$-4,185/yr
Cap rate
4.96%
Cash-on-cash
-4.75%
DSCR
0.79
1% rule
0.84%
Cash to close
$88,172
Investor read
- This is a 4-bed/2.5-bath single-family listed at $315k.
- At list price, monthly cash flow is $-349 ($-4k/yr) — negative.
- To cash-flow at today's rent, offer at most $253k (19.6% below list).
- To meet the 1% rule (rent ≥ 1% of price), the offer needs to be $266k (15.6% below list).
- It's been on market 39 days — a 3% lower offer ($305k) is reasonable based on typical stale-listing flexibility.
- Recommended offer: $253k (19.6% below list) — sets the bar for cash-flow.
- Local home prices are declining (-3.0%/yr); year-one equity from $2k of loan paydown is wiped out by about $9k of value loss. Plan a longer hold.
- Location reads 81/100 on livability (#64 in MI, #1,364 nationally) — a professional / high-income tenant draw. Strengths: employment A+, housing A+, crime A; Watch: amenities D, health & safety F.
- Farmington Public School District (urban): math 45% / reading 58% proficiency, ranked #78 of 540 in MI (top 14%) — acceptable for families but not a draw, mixed tenant base, ~2y average lease; only 19% free/reduced lunch — higher-income household profile.
- Zoned schools: Forest Elementary School (math 57% / reading 62%, grade B-, #200 of 1,397 statewide, top 16%, 397 students, 19% FRL); Warner Middle School (math 37% / reading 56%, grade D+, #150 of 493 statewide, top 31%, 571 students, 34% FRL); North Farmington High School (math 48% / reading 67%, grade C, #95 of 713 statewide, top 14%, 1,268 students, 30% FRL).
- Market conditions: Rents rising fast (+9.7%/yr); 89 active listings in the ZIP; 4 comparable units currently listed for rent nearby; rentals at typical pace (median 19d on market — plan ~3-4 weeks tenant-placement turnaround); high-income renter base; 2,614 units permitted in Oakland County in 2024 (721 in 5+ unit buildings).
- Oakland County population projected at +10% by 2050 — modest demand growth; plan on rents tracking national, not racing it.
- 13 sale attempts since 28y ago; this cycle's ask has dropped $55k (15%) from the opening price — seller is motivated, your offer sets the floor, not the list.
- Cap rate 5.0% vs local median 3.4% in Farmington Hills — top-decile yield for the area; either an underpriced asset or a hidden risk that comps aren't pricing in. Stress-test before assuming the spread holds.
Questions for listing agent
- What do current leases actually rent for vs. the listed asking? Can we see a recent rent roll and the last 12 months of T-12 income?
- It's been on market 39 days. Have you received any prior offers? Is the seller open to a 20% concession, seller financing, or rate buy-down credit?
- Built in 1968 — when were the roof, HVAC, electrical panel, plumbing, and water heater last replaced?
- What does the HOA fee cover, when was the last increase, and are there any pending special assessments or reserve-fund shortfalls?
- Is there a deadline driving the sale (1031 exchange, divorce, estate, relocation)? That informs how much negotiation room exists.
- Schools are B-rated — typically a magnet for longer-tenancy family renters. What's the average tenant stay here, and is there a school-zone premium baked into asking?
- The area grade is low — what's the realistic commute time and amenity access for the typical tenant pool here? Any planned neighborhood developments (good or bad) we should know about?
- What's the average days-on-market for RENTAL listings here right now (not sales)? A rising rental-DOM trend means longer vacancies and softer asking-rent achievability than the comps imply.
CashFlowRE · CFR-AC6AKH3PGMRPKZ
· Data 4 weeks ago
cashflowre.app · 2026-05-29