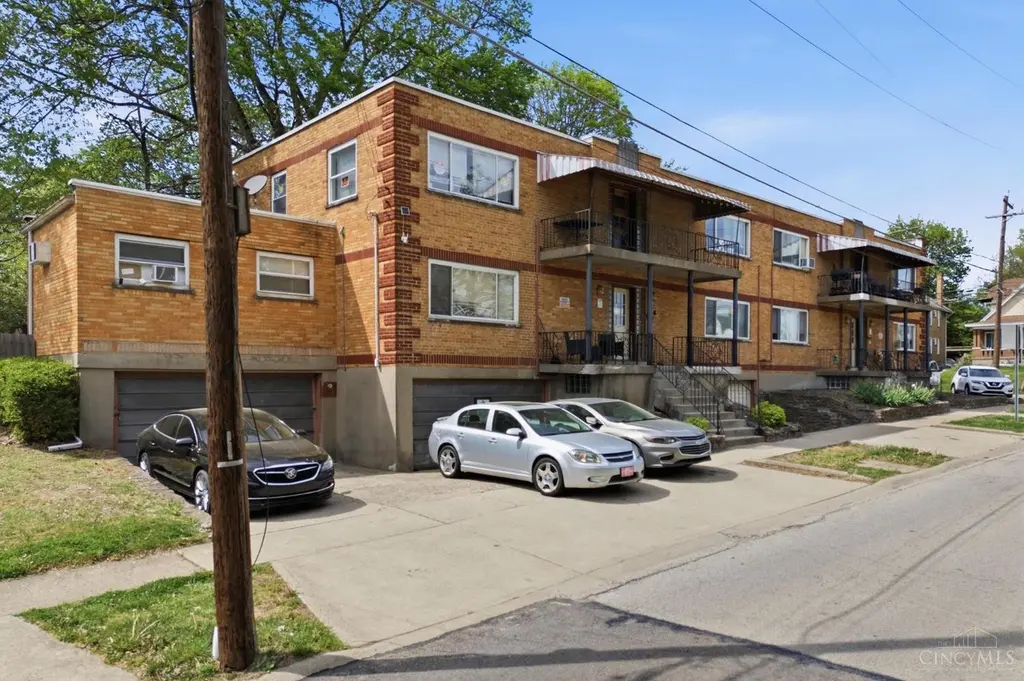
781 Clanora Dr
Cincinnati, OH 45205
$730,000C+
99 bd · None ba ·
— sqft ·
Built 1948
· MultiFamily
· Active
· 50 DOM
Cashflow @ list (25.0% down · 7.5%)
Estimated rent
$9,350/mo
Mortgage (P&I)
−$3,828
Tax + insurance
−$1,481
HOA
−$0
Vac / Maint / Mgmt
−$1,964
Net cashflow
$2,077/mo
Annual
$24,924/yr
Cap rate
9.71%
Cash-on-cash
12.19%
DSCR
1.54
1% rule
1.28%
Cash to close
$204,400
Investor read
- This is a 7×1bd/1ba + 2×2bd/1ba units multifamily listed at $730k.
- At list price, monthly cash flow is $2k ($25k/yr) — positive. Per door: $231/mo.
- The deal already cash-flows at list — no discount required.
- Meets the 1% rule at list price ($9k rent vs $730k).
- It's been on market 50 days — a 3% lower offer ($708k) is reasonable based on typical stale-listing flexibility.
- Recommended offer: $708k (3.0% below list) — sets the bar for market timing.
- Local home prices are declining (-3.0%/yr); year-one equity from $5k of loan paydown is wiped out by about $22k of value loss. Plan a longer hold.
- Location reads 80/100 on livability (#130 in OH, #1,856 nationally) — a professional / high-income tenant draw. Strengths: amenities A+, commute A+, cost of living A+; Watch: employment D, crime F.
- Cincinnati Public Schools (urban): math 25% / reading 36% proficiency, ranked #581 of 656 in OH (top 89%) — families likely to look elsewhere, expect single-tenant / working-renter base with shorter leases; 70% free/reduced lunch — lower-income household profile, screen leases tightly.
- Watch-outs: built in 1948 — expect roof / HVAC / electrical / plumbing capex.
- Market conditions: Rents rising (+3.3%/yr); 69 active listings in the ZIP; lower-income renter base — watch delinquency; 801 units permitted in Hamilton County in 2024 (190 in 5+ unit buildings).
- Current owner paid $495k; 47% above their basis — modest negotiation headroom, anchor on the comps not their cost.
- At projected returns (-3.0% appreciation + 3.3% rent growth), your $204k cash investment doubles in ~9 years — after that, you're playing with house money.
- Cap rate 9.7% vs local median 3.9% in Cincinnati — top-decile yield for the area; either an underpriced asset or a hidden risk that comps aren't pricing in. Stress-test before assuming the spread holds.
- At $9,350/mo this rent would consume 257% of the median local household income ($44k/yr) (locally 980% of renters already pay >50% of income on rent) — very limited rent-growth headroom before tenants either downsize or default.
Questions for listing agent
- It's been on market 50 days. Have you received any prior offers? Is the seller open to a 3% concession, seller financing, or rate buy-down credit?
- Can we see the unit-by-unit rent roll, current vacancy, and any below-market leases? What's the average tenancy length?
- What capital expenditures (roof, boiler, parking lot, exteriors) have been made in the last 5 years, and what's planned in the next 2?
- Built in 1948 — when were the roof, HVAC, electrical panel, plumbing, and water heater last replaced?
- Is there a deadline driving the sale (1031 exchange, divorce, estate, relocation)? That informs how much negotiation room exists.
- Schools are B-rated — typically a magnet for longer-tenancy family renters. What's the average tenant stay here, and is there a school-zone premium baked into asking?
- Crime grade is F in this area — have there been break-ins, vandalism, or insurance claims at this property in the last 3 years? What carrier currently insures it and at what premium?
- What's the average days-on-market for RENTAL listings here right now (not sales)? A rising rental-DOM trend means longer vacancies and softer asking-rent achievability than the comps imply.
CashFlowRE · CFR-AD31QJEJC391K0
· Data 2 days ago
cashflowre.app · 2026-05-29