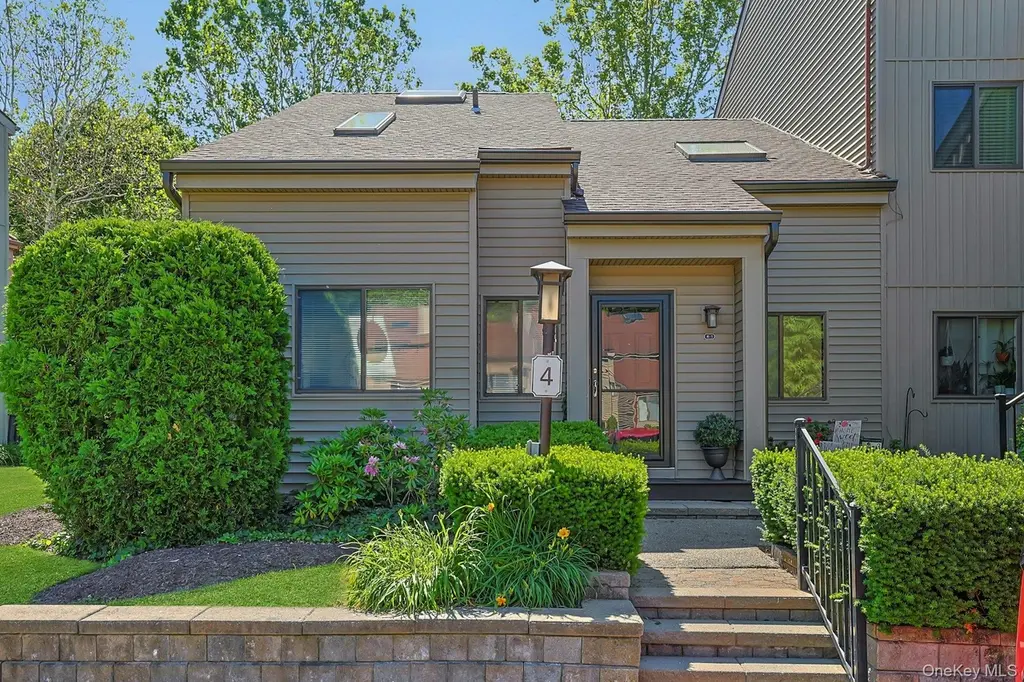
4 Steven Dr #1
Ossining, NY 10562
$499,000B
3 bd · 3.0 ba ·
2,463 sqft ·
Built 1988
· MultiFamily
· Active
· 6 DOM
Cashflow @ list (25.0% down · 7.5%)
Estimated rent
$14,715/mo
Mortgage (P&I)
−$2,617
Tax + insurance
−$549
HOA
−$455
Vac / Maint / Mgmt
−$3,090
Net cashflow
$8,004/mo
Annual
$96,052/yr
Cap rate
25.54%
Cash-on-cash
68.75%
DSCR
4.06
1% rule
2.95%
Cash to close
$139,720
Investor read
- This is a 3-bed/3.0-bath multifamily listed at $499k.
- At list price, monthly cash flow is $8k ($96k/yr) — positive.
- The deal already cash-flows at list — no discount required.
- Meets the 1% rule at list price ($15k rent vs $499k).
- Only 6 days on market — expect competitive offers; lowballing is unlikely to land.
- Local home prices are declining (-3.0%/yr); year-one equity from $3k of loan paydown is wiped out by about $15k of value loss. Plan a longer hold.
- Location reads 80/100 on livability (#116 in NY, #1,876 nationally) — a professional / high-income tenant draw. Strengths: commute A+, employment A+, health & safety A; Watch: cost of living F.
- Ossining Union Free School District (suburban): math 72% / reading 72% proficiency, ranked #104 of 590 in NY (top 18%) — strong family-tenant draw, lease renewals of 3-5y typical.
- Zoned schools: Brookside School (727 students, 50% FRL); Anne M Dorner Middle School (math 42% / reading 64%, grade C+, #231 of 729 statewide, top 32%, 1,033 students, 51% FRL); Ossining High School (math 86% / reading 82%, grade A, #404 of 1,100 statewide, top 37%, 1,552 students, 51% FRL).
- Market conditions: 134 active listings in the ZIP; 1 comparable units currently listed for rent nearby; high-income renter base; 954 units permitted in Westchester County in 2024 (649 in 5+ unit buildings).
- Westchester County population projected at +10% by 2050 — modest demand growth; plan on rents tracking national, not racing it.
- Current owner paid $419k; 19% above their basis — modest negotiation headroom, anchor on the comps not their cost.
- At projected returns (-3.0% appreciation + 3.0% rent growth), your $140k cash investment doubles in ~2 years — after that, you're playing with house money.
- Climate carrying-cost: extreme-heat days projected 7→16/yr by 2055 (HVAC capex compounding) — expect insurance premiums to compound above CPI over the hold.
- Cap rate 25.5% vs local median 2.9% in Ossining — top-decile yield for the area; either an underpriced asset or a hidden risk that comps aren't pricing in. Stress-test before assuming the spread holds.
- At $14,715/mo this rent would consume 153% of the median local household income ($116k/yr) (locally 1248% of renters already pay >50% of income on rent) — very limited rent-growth headroom before tenants either downsize or default.
Questions for listing agent
- What does the HOA fee cover, when was the last increase, and are there any pending special assessments or reserve-fund shortfalls?
- Is there a deadline driving the sale (1031 exchange, divorce, estate, relocation)? That informs how much negotiation room exists.
- Schools are D-rated, which usually means shorter tenancies and higher turnover. Who's the typical renter profile here, and what's been the actual vacancy rate?
- What's the average days-on-market for RENTAL listings here right now (not sales)? A rising rental-DOM trend means longer vacancies and softer asking-rent achievability than the comps imply.
- What's the recent tenant-quality profile in this submarket — average credit score on applications, eviction rate, late-payment / NSF rate, and stable-employment percentage? A property-management company in the area should have these aggregated.
- How much new apartment / multifamily construction is in the pipeline within 1–3 miles? Heavy new supply (>2% of stock underway) typically softens rents 12–24 months out; light construction supports rent growth.
CashFlowRE · CFR-AFEF039N1KNHS3
· Data 1 week ago
cashflowre.app · 2026-05-29