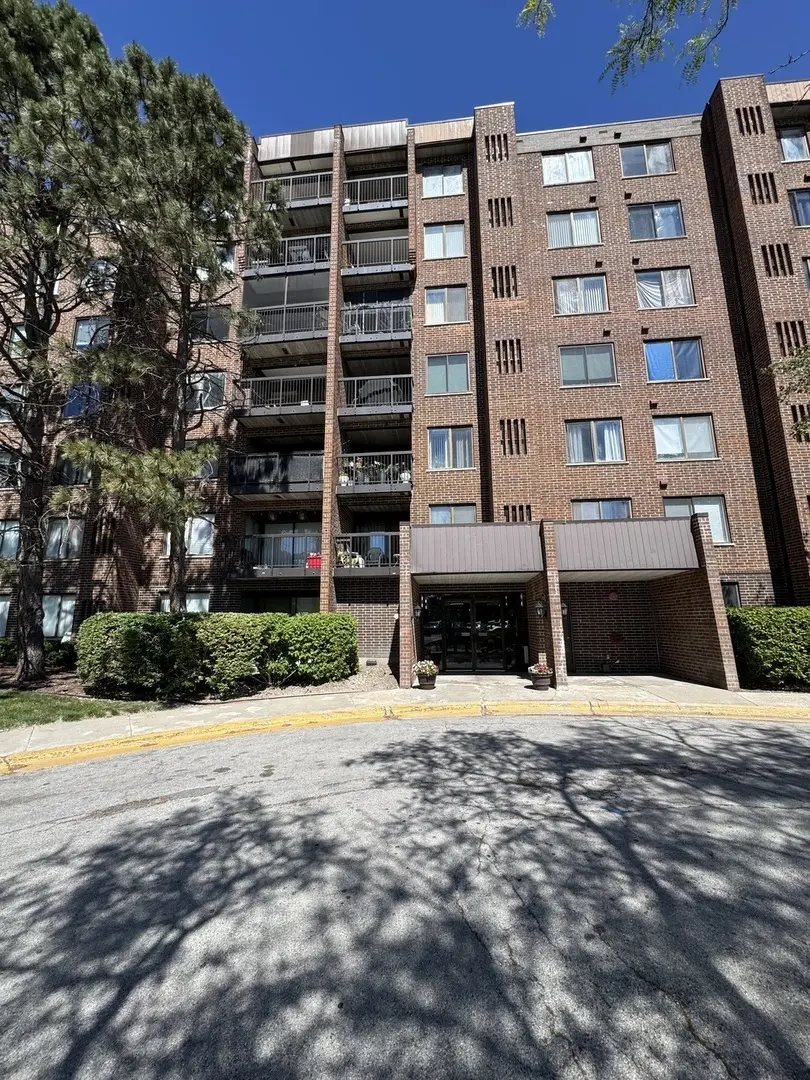
400 Park Ave #512
Calumet City, IL 60409
$95,000B-
2 bd · 2.0 ba ·
1,050 sqft ·
Built 1978
· Condo
· Active
· 15 DOM
Cashflow @ list (25.0% down · 7.5%)
Estimated rent
$2,308/mo
Mortgage (P&I)
−$498
Tax + insurance
−$113
HOA
−$411
Vac / Maint / Mgmt
−$485
Net cashflow
$801/mo
Annual
$9,616/yr
Cap rate
16.41%
Cash-on-cash
36.15%
DSCR
2.61
1% rule
2.43%
Cash to close
$26,600
Investor read
- This is a 2-bed/2.0-bath condo listed at $95k.
- At list price, monthly cash flow is $801 ($10k/yr) — positive.
- The deal already cash-flows at list — no discount required.
- Meets the 1% rule at list price ($2k rent vs $95k).
- It's been on market 15 days — a 2% lower offer ($94k) is reasonable based on typical stale-listing flexibility.
- Recommended offer: $94k (1.5% below list) — sets the bar for market timing.
- Local home prices are declining (-3.0%/yr); year-one equity from $657 of loan paydown is wiped out by about $3k of value loss. Plan a longer hold.
- Location reads 71/100 on livability (#330 in IL) — a middle-class / working-renter tenant base. Strengths: commute A+, cost of living A+, housing A+; Watch: employment C-, schools F, crime D-.
- Thornton Twp Hsd 205 (suburban): math 7% / reading 8% proficiency, ranked #594 of 620 in IL (top 96%) — low school quality limits family demand, transient renter base, plan for 1-2y turnover.
- Market conditions: Rents rising fast (+6.2%/yr); 198 active listings in the ZIP; 5 comparable units currently listed for rent nearby; rentals leasing fast (median 6d on market — plan ~1-2 weeks tenant-placement turnaround); 6,272 units permitted in Cook County in 2024 (4,658 in 5+ unit buildings).
- Current owner paid $58k; list at $95k implies a 65% gain — meaningful room to come down on a strong offer.
- At projected returns (-3.0% appreciation + 6.2% rent growth), your $27k cash investment doubles in ~4 years — after that, you're playing with house money.
- Cap rate 16.4% vs local median 8.2% in Calumet City — top-decile yield for the area; either an underpriced asset or a hidden risk that comps aren't pricing in. Stress-test before assuming the spread holds.
- At $2,308/mo this rent would consume 50% of the median local household income ($55k/yr) (locally 2415% of renters already pay >50% of income on rent) — very limited rent-growth headroom before tenants either downsize or default.
Questions for listing agent
- Built in 1978 — when were the roof, HVAC, electrical panel, plumbing, and water heater last replaced?
- What does the HOA fee cover, when was the last increase, and are there any pending special assessments or reserve-fund shortfalls?
- Any open or pending special assessments — roof, HVAC, plumbing, elevator, façade? What's the per-unit balance and payoff schedule, and is the seller paying it off at close or rolling it to the buyer?
- Is there a deadline driving the sale (1031 exchange, divorce, estate, relocation)? That informs how much negotiation room exists.
- Schools are F-rated, which usually means shorter tenancies and higher turnover. Who's the typical renter profile here, and what's been the actual vacancy rate?
- Crime grade is D in this area — have there been break-ins, vandalism, or insurance claims at this property in the last 3 years? What carrier currently insures it and at what premium?
- What's the average days-on-market for RENTAL listings here right now (not sales)? A rising rental-DOM trend means longer vacancies and softer asking-rent achievability than the comps imply.
- What's the recent tenant-quality profile in this submarket — average credit score on applications, eviction rate, late-payment / NSF rate, and stable-employment percentage? A property-management company in the area should have these aggregated.
CashFlowRE · CFR-AFMKMVB8DBD6ZA
· Data 2 days ago
cashflowre.app · 2026-05-29