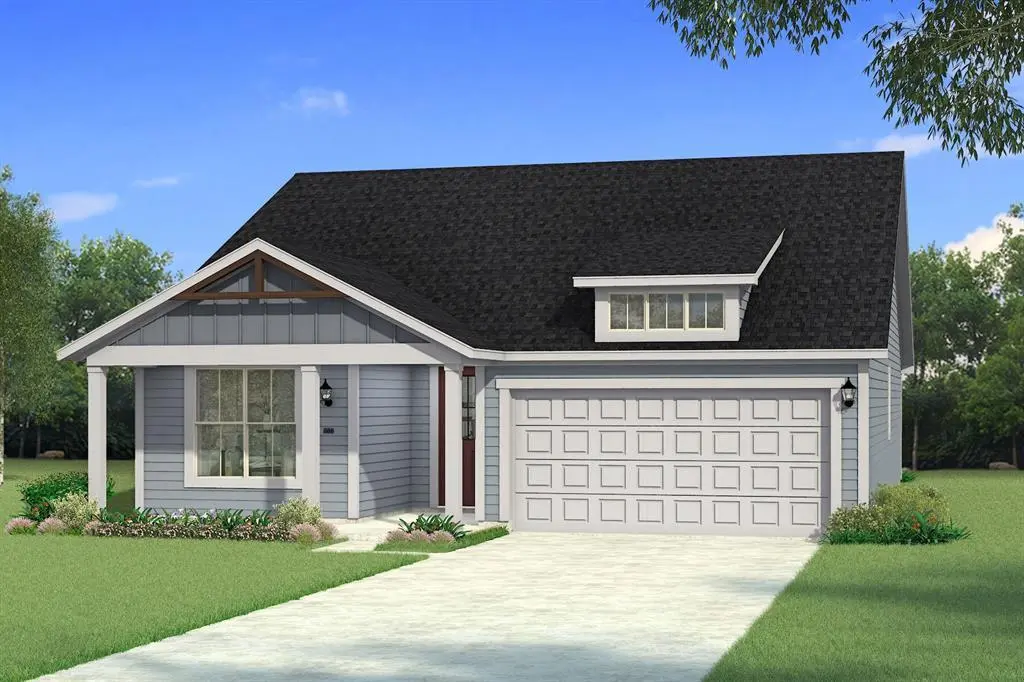
605 Marcus Ln
Crowley, TX 76036
$293,413D-
3 bd · 2.0 ba ·
1,502 sqft ·
Built 2026
· Other
· Active
· 79 DOM
Cashflow @ list (25.0% down · 7.5%)
Estimated rent
$2,183/mo
Mortgage (P&I)
−$1,539
Tax + insurance
−$232
HOA
−$42
Vac / Maint / Mgmt
−$458
Net cashflow
$-88/mo
Annual
$-1,060/yr
Cap rate
5.93%
Cash-on-cash
-1.29%
DSCR
0.94
1% rule
0.74%
Cash to close
$82,156
Investor read
- This is a 3-bed/2.0-bath other listed at $293k.
- At list price, monthly cash flow is $-88 ($-1k/yr) — negative.
- To cash-flow at today's rent, offer at most $278k (5.3% below list).
- To meet the 1% rule (rent ≥ 1% of price), the offer needs to be $218k (25.6% below list).
- It's been on market 79 days — a 6% lower offer ($276k) is reasonable based on typical stale-listing flexibility.
- Recommended offer: $218k (25.6% below list) — sets the bar for 1% rule.
- Local home prices are declining (-3.0%/yr); year-one equity from $2k of loan paydown is wiped out by about $9k of value loss. Plan a longer hold.
- Location reads 76/100 on livability (#103 in TX, #3,462 nationally) — a middle-class / working-renter tenant base. Strengths: cost of living A+, housing A+, health & safety A+; Watch: schools D+, amenities F, commute F.
- Crowley ISD (urban): math 23% / reading 32% proficiency, ranked #643 of 826 in TX (top 78%) — low school quality limits family demand, transient renter base, plan for 1-2y turnover.
- Market conditions: Rents rising (+2.3%/yr); 1018 active listings in the ZIP; 40 comparable units currently listed for rent nearby; rentals at typical pace (median 23d on market — plan ~3-4 weeks tenant-placement turnaround); solid renter incomes; 18,938 units permitted in Tarrant County in 2024 (8,336 in 5+ unit buildings).
- Tarrant County population projected at +41% by 2050 — long-run rental-demand tailwind backs the buy-and-hold thesis.
- Cap rate 5.9% vs local median 4.5% in Crowley — top-decile yield for the area; either an underpriced asset or a hidden risk that comps aren't pricing in. Stress-test before assuming the spread holds.
Questions for listing agent
- What do current leases actually rent for vs. the listed asking? Can we see a recent rent roll and the last 12 months of T-12 income?
- It's been on market 79 days. Have you received any prior offers? Is the seller open to a 26% concession, seller financing, or rate buy-down credit?
- What does the HOA fee cover, when was the last increase, and are there any pending special assessments or reserve-fund shortfalls?
- Why hasn't it sold? Are there any deal-killer items the seller is aware of (foundation, flood, title, zoning, code violations)?
- Is there a deadline driving the sale (1031 exchange, divorce, estate, relocation)? That informs how much negotiation room exists.
- Schools are D-rated, which usually means shorter tenancies and higher turnover. Who's the typical renter profile here, and what's been the actual vacancy rate?
- The area grade is low — what's the realistic commute time and amenity access for the typical tenant pool here? Any planned neighborhood developments (good or bad) we should know about?
- What's the average days-on-market for RENTAL listings here right now (not sales)? A rising rental-DOM trend means longer vacancies and softer asking-rent achievability than the comps imply.
CashFlowRE · CFR-AM63EZC3BBEFM4
· Data 2 days ago
cashflowre.app · 2026-05-29