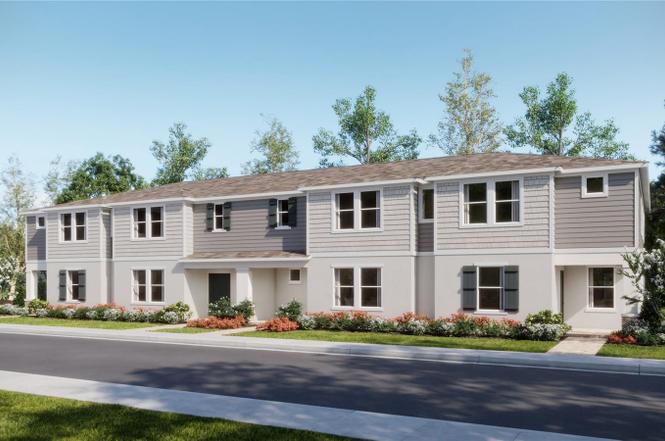
5116 Clay Whaley Rd
St. Cloud, FL 34772
$301,000F
3 bd · 2.5 ba ·
1,664 sqft ·
Built 2026
· Land
· Pending
· 55 DOM
Cashflow @ list (25.0% down · 7.5%)
Estimated rent
$2,524/mo
Mortgage (P&I)
−$1,578
Tax + insurance
−$502
HOA
−$216
Vac / Maint / Mgmt
−$530
Net cashflow
$-302/mo
Annual
$-3,627/yr
Cap rate
5.09%
Cash-on-cash
-4.30%
DSCR
0.81
1% rule
0.84%
Cash to close
$84,280
Investor read
- This is a 3-bed/2.5-bath land listed at $301k.
- At list price, monthly cash flow is $-302 ($-4k/yr) — negative.
- To cash-flow at today's rent, offer at most $257k (14.5% below list).
- To meet the 1% rule (rent ≥ 1% of price), the offer needs to be $252k (16.1% below list).
- It's been on market 55 days — a 3% lower offer ($292k) is reasonable based on typical stale-listing flexibility.
- Recommended offer: $252k (16.1% below list) — sets the bar for 1% rule.
- Local home prices are declining (-3.0%/yr); year-one equity from $2k of loan paydown is wiped out by about $9k of value loss. Plan a longer hold.
- Location reads: area grade F — affects rentability + tenant quality, not the cash-flow math above.
- Osceola (suburban): math 39% / reading 45% proficiency, ranked #60 of 73 in FL (top 82%) — families likely to look elsewhere, expect single-tenant / working-renter base with shorter leases; 60% free/reduced lunch — lower-income household profile, screen leases tightly.
- Zoned schools: Neptune Elementary School (math 42% / reading 44%, grade F, #1,366 of 2,144 statewide, top 64%, 993 students, 46% FRL); St. Cloud High School (math 32% / reading 50%, grade F, #289 of 667 statewide, top 44%, 2,264 students, 51% FRL).
- Market conditions: Rents rising (+2.3%/yr); 868 active listings in the ZIP; 30 comparable units currently listed for rent nearby; rentals at typical pace (median 25d on market — plan ~3-4 weeks tenant-placement turnaround); solid renter incomes; 8,813 units permitted in Osceola County in 2024 (3,072 in 5+ unit buildings).
- Osceola County population projected at +73% by 2050 — long-run rental-demand tailwind backs the buy-and-hold thesis.
- Cap rate 5.1% vs local median 4.0% in St. Cloud — meaningfully above typical; check what's discounted (condition, days-on-market, listing class) to confirm the premium yield is real.
- This rent runs 31% of the median local income ($98k/yr) — at the standard rent-burdened threshold; future hikes will face affordability resistance.
Questions for listing agent
- What do current leases actually rent for vs. the listed asking? Can we see a recent rent roll and the last 12 months of T-12 income?
- It's been on market 55 days. Have you received any prior offers? Is the seller open to a 16% concession, seller financing, or rate buy-down credit?
- What does the HOA fee cover, when was the last increase, and are there any pending special assessments or reserve-fund shortfalls?
- Is there a deadline driving the sale (1031 exchange, divorce, estate, relocation)? That informs how much negotiation room exists.
- The area grade is low — what's the realistic commute time and amenity access for the typical tenant pool here? Any planned neighborhood developments (good or bad) we should know about?
- What's the average days-on-market for RENTAL listings here right now (not sales)? A rising rental-DOM trend means longer vacancies and softer asking-rent achievability than the comps imply.
- What's the recent tenant-quality profile in this submarket — average credit score on applications, eviction rate, late-payment / NSF rate, and stable-employment percentage? A property-management company in the area should have these aggregated.
- How much new for-sale + rental construction is in the pipeline within 1–3 miles? Heavy new supply typically softens prices + rents 12–24 months out; constrained supply supports both.
CashFlowRE · CFR-ANCG4K3RAV3YH3
· Data 1 week ago
cashflowre.app · 2026-05-29