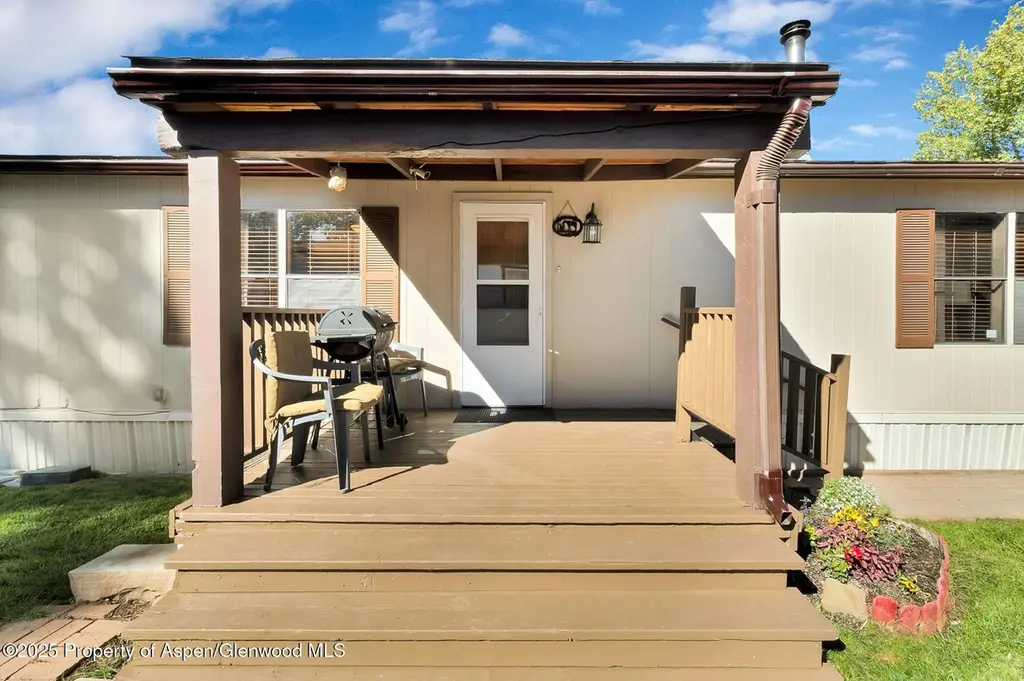
5387 County Road 154 #70
Cattle Creek, CO 81601
$280,000C-
3 bd · 2.0 ba ·
1,456 sqft ·
Built 1983
· Manufactured
· Pending
· 4 DOM
Cashflow @ list (25.0% down · 7.5%)
Estimated rent
$2,872/mo
Mortgage (P&I)
−$1,468
Tax + insurance
−$268
HOA
−$0
Vac / Maint / Mgmt
−$603
Net cashflow
$533/mo
Annual
$6,393/yr
Cap rate
8.86%
Cash-on-cash
9.17%
DSCR
1.41
1% rule
1.03%
Cash to close
$78,400
Investor read
- This is a 3-bed/2.0-bath manufactured listed at $280k.
- At list price, monthly cash flow is $533 ($6k/yr) — positive.
- The deal already cash-flows at list — no discount required.
- Meets the 1% rule at list price ($3k rent vs $280k).
- Only 4 days on market — expect competitive offers; lowballing is unlikely to land.
- Local home prices are declining (-3.0%/yr); year-one equity from $2k of loan paydown is wiped out by about $8k of value loss. Plan a longer hold.
- Location reads 48/100 on livability (#419 in CO) — a working-class tenant base; expect higher turnover. Strengths: crime A, cost of living B+; Watch: amenities F, commute F, housing F.
- Roaring Fork School District No. Re-1 (town): math 28% / reading 39% proficiency, ranked #37 of 86 in CO (top 43%) — families likely to look elsewhere, expect single-tenant / working-renter base with shorter leases.
- Zoned schools: Sopris Elementary School (math 42% / reading 32%, grade F, #405 of 966 statewide, top 43%, 342 students, 30% FRL); Glenwood Springs Middle School (math 18% / reading 22%, grade F, #202 of 270 statewide, top 75%, 408 students, 40% FRL); Glenwood Springs High School (math 42% / reading 62%, grade D+, #90 of 381 statewide, top 24%, 1,002 students, 23% FRL) — zoned schools at 31% FRL track the district average.
- Watch-outs: flood insurance adds $66/mo.
- Market conditions: Rents falling (-3.8%/yr); 198 active listings in the ZIP; solid renter incomes; 171 units permitted in Garfield County in 2024 (64 in 5+ unit buildings).
- Garfield County population projected at +5% by 2050 — modest demand growth; plan on rents tracking national, not racing it.
- Climate carrying-cost: severe flood risk; major wildfire risk — expect insurance premiums to compound above CPI over the hold.
- Cap rate 8.9% vs local median 0.4% in Cattle Creek — top-decile yield for the area; either an underpriced asset or a hidden risk that comps aren't pricing in. Stress-test before assuming the spread holds.
- This rent runs 32% of the median local income ($109k/yr) — at the standard rent-burdened threshold; future hikes will face affordability resistance.
Questions for listing agent
- What's the actual annual flood-insurance premium (NFIP or private), and is the property in a SFHA with mandatory coverage?
- Is there a deadline driving the sale (1031 exchange, divorce, estate, relocation)? That informs how much negotiation room exists.
- Schools are F-rated, which usually means shorter tenancies and higher turnover. Who's the typical renter profile here, and what's been the actual vacancy rate?
- What's the average days-on-market for RENTAL listings here right now (not sales)? A rising rental-DOM trend means longer vacancies and softer asking-rent achievability than the comps imply.
- What's the recent tenant-quality profile in this submarket — average credit score on applications, eviction rate, late-payment / NSF rate, and stable-employment percentage? A property-management company in the area should have these aggregated.
- How much new for-sale + rental construction is in the pipeline within 1–3 miles? Heavy new supply typically softens prices + rents 12–24 months out; constrained supply supports both.
CashFlowRE · CFR-ANJKBS3FRVAEAK
· Data 1 week ago
cashflowre.app · 2026-05-29