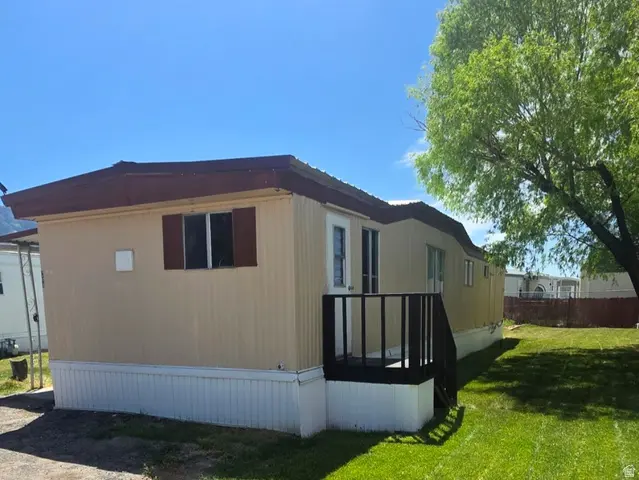
2491 Us-89 Hwy #204
Pleasant View, UT 84404
$18,000D+
2 bd · 1.0 ba ·
784 sqft ·
Built 1972
· Manufactured
· Active
· 13 DOM
Cashflow @ list (25.0% down · 7.5%)
Estimated rent
$1,494/mo
Mortgage (P&I)
−$94
Tax + insurance
−$30
HOA
−$964
Vac / Maint / Mgmt
−$314
Net cashflow
$92/mo
Annual
$1,104/yr
Cap rate
12.42%
Cash-on-cash
21.90%
DSCR
1.97
1% rule
8.30%
Cash to close
$5,040
Investor read
- This is a 2-bed/1.0-bath manufactured listed at $18k.
- At list price, monthly cash flow is $92 ($1k/yr) — positive.
- The deal already cash-flows at list — no discount required.
- Meets the 1% rule at list price ($1k rent vs $18k).
- Only 13 days on market — expect competitive offers; lowballing is unlikely to land.
- Local home prices are declining (-3.0%/yr); year-one equity from $124 of loan paydown is wiped out by about $540 of value loss. Plan a longer hold.
- Location reads 77/100 on livability (#51 in UT, #2,901 nationally) — a middle-class / working-renter tenant base. Strengths: crime A+, commute A+, employment A+; Watch: cost of living D, amenities F, health & safety F.
- Weber District (suburban): math 36% / reading 35% proficiency, ranked #56 of 80 in UT (top 70%) — families likely to look elsewhere, expect single-tenant / working-renter base with shorter leases.
- Zoned schools: Lomond View School (math 63% / reading 56%, grade B-, #59 of 585 statewide, top 10%, 483 students, 14% FRL); Wahlquist Jr High (math 41% / reading 31%, grade F, #93 of 138 statewide, top 67%, 1,260 students, 12% FRL); Weber High (math 33% / reading 49%, grade F, #60 of 171 statewide, top 35%, 2,037 students, 15% FRL).
- Watch-outs: HOA is 65% of rent.
- Market conditions: Rents rising (+2.3%/yr); 611 active listings in the ZIP; 3 comparable units currently listed for rent nearby; rentals at typical pace (median 14d on market — plan ~3-4 weeks tenant-placement turnaround); solid renter incomes; 1,630 units permitted in Weber County in 2024 (521 in 5+ unit buildings).
- Weber County population projected at +24% by 2050 — long-run rental-demand tailwind backs the buy-and-hold thesis.
- 2 sale attempts with the ask held roughly flat each time — persistent listings suggest the price (not the market) is what's stuck; bring a comps-based counter.
- At projected returns (-3.0% appreciation + 2.3% rent growth), your $5k cash investment doubles in ~7 years — after that, you're playing with house money.
Questions for listing agent
- Built in 1972 — when were the roof, HVAC, electrical panel, plumbing, and water heater last replaced?
- What does the HOA fee cover, when was the last increase, and are there any pending special assessments or reserve-fund shortfalls?
- Is there a deadline driving the sale (1031 exchange, divorce, estate, relocation)? That informs how much negotiation room exists.
- Schools are B-rated — typically a magnet for longer-tenancy family renters. What's the average tenant stay here, and is there a school-zone premium baked into asking?
- The area grade is low — what's the realistic commute time and amenity access for the typical tenant pool here? Any planned neighborhood developments (good or bad) we should know about?
- What's the average days-on-market for RENTAL listings here right now (not sales)? A rising rental-DOM trend means longer vacancies and softer asking-rent achievability than the comps imply.
- What's the recent tenant-quality profile in this submarket — average credit score on applications, eviction rate, late-payment / NSF rate, and stable-employment percentage? A property-management company in the area should have these aggregated.
- How much new for-sale + rental construction is in the pipeline within 1–3 miles? Heavy new supply typically softens prices + rents 12–24 months out; constrained supply supports both.
CashFlowRE · CFR-APPMESAM4158M7
· Data 2 days ago
cashflowre.app · 2026-05-29