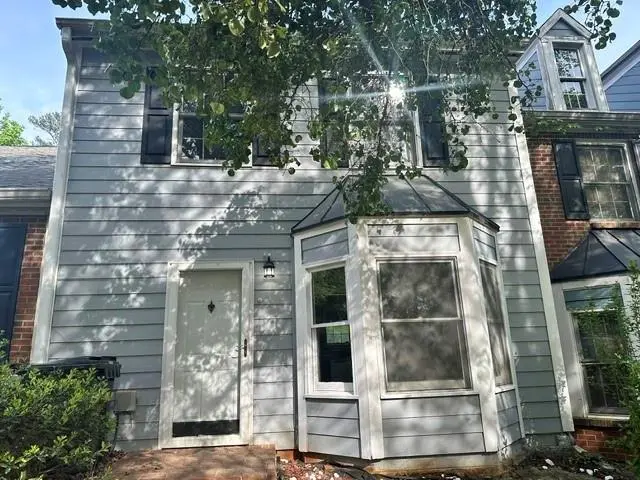
1270 Warsaw Rd
Roswell, GA 30076
$260,000D-
2 bd · 1.5 ba ·
1,320 sqft ·
Built 1981
· Townhouse
· Pending
· 45 DOM
Cashflow @ list (25.0% down · 7.5%)
Estimated rent
$1,925/mo
Mortgage (P&I)
−$1,363
Tax + insurance
−$282
HOA
−$27
Vac / Maint / Mgmt
−$404
Net cashflow
$-151/mo
Annual
$-1,817/yr
Cap rate
5.59%
Cash-on-cash
-2.50%
DSCR
0.89
1% rule
0.74%
Cash to close
$72,800
Investor read
- This is a 2-bed/1.5-bath townhouse listed at $260k.
- At list price, monthly cash flow is $-151 ($-2k/yr) — negative.
- To cash-flow at today's rent, offer at most $233k (10.3% below list).
- To meet the 1% rule (rent ≥ 1% of price), the offer needs to be $192k (26.0% below list).
- It's been on market 45 days — a 3% lower offer ($252k) is reasonable based on typical stale-listing flexibility.
- Recommended offer: $192k (26.0% below list) — sets the bar for 1% rule.
- Local home prices are declining (-3.0%/yr); year-one equity from $2k of loan paydown is wiped out by about $8k of value loss. Plan a longer hold.
- Location reads 79/100 on livability (#12 in GA, #1,990 nationally) — a middle-class / working-renter tenant base. Strengths: employment A+, housing A+, crime A; Watch: commute F, cost of living F.
- Fulton County (suburban): math 49% / reading 53% proficiency, ranked #12 of 174 in GA (top 7%) — acceptable for families but not a draw, mixed tenant base, ~2y average lease.
- Market conditions: Rents rising (+1.0%/yr); 252 active listings in the ZIP; 33 comparable units currently listed for rent nearby; rentals at typical pace (median 19d on market — plan ~3-4 weeks tenant-placement turnaround); high-income renter base; 11,565 units permitted in Fulton County in 2024 (8,159 in 5+ unit buildings).
- Fulton County population projected at +38% by 2050 — long-run rental-demand tailwind backs the buy-and-hold thesis.
- 2 sale attempts since 2y ago with the ask held roughly flat each time — persistent listings suggest the price (not the market) is what's stuck; bring a comps-based counter.
- Current owner paid $50k; list at $260k implies a 420% gain — meaningful room to come down on a strong offer.
- Climate carrying-cost: extreme-heat days projected 7→18/yr by 2055 (HVAC capex compounding) — expect insurance premiums to compound above CPI over the hold.
- Cap rate 5.6% vs local median 2.7% in Roswell — top-decile yield for the area; either an underpriced asset or a hidden risk that comps aren't pricing in. Stress-test before assuming the spread holds.
Questions for listing agent
- What do current leases actually rent for vs. the listed asking? Can we see a recent rent roll and the last 12 months of T-12 income?
- It's been on market 45 days. Have you received any prior offers? Is the seller open to a 26% concession, seller financing, or rate buy-down credit?
- What does the HOA fee cover, when was the last increase, and are there any pending special assessments or reserve-fund shortfalls?
- Is there a deadline driving the sale (1031 exchange, divorce, estate, relocation)? That informs how much negotiation room exists.
- Schools are B-rated — typically a magnet for longer-tenancy family renters. What's the average tenant stay here, and is there a school-zone premium baked into asking?
- The area grade is low — what's the realistic commute time and amenity access for the typical tenant pool here? Any planned neighborhood developments (good or bad) we should know about?
- What's the average days-on-market for RENTAL listings here right now (not sales)? A rising rental-DOM trend means longer vacancies and softer asking-rent achievability than the comps imply.
- What's the recent tenant-quality profile in this submarket — average credit score on applications, eviction rate, late-payment / NSF rate, and stable-employment percentage? A property-management company in the area should have these aggregated.
CashFlowRE · CFR-APYQ6DC82GZFPM
· Data 2 weeks ago
cashflowre.app · 2026-05-29