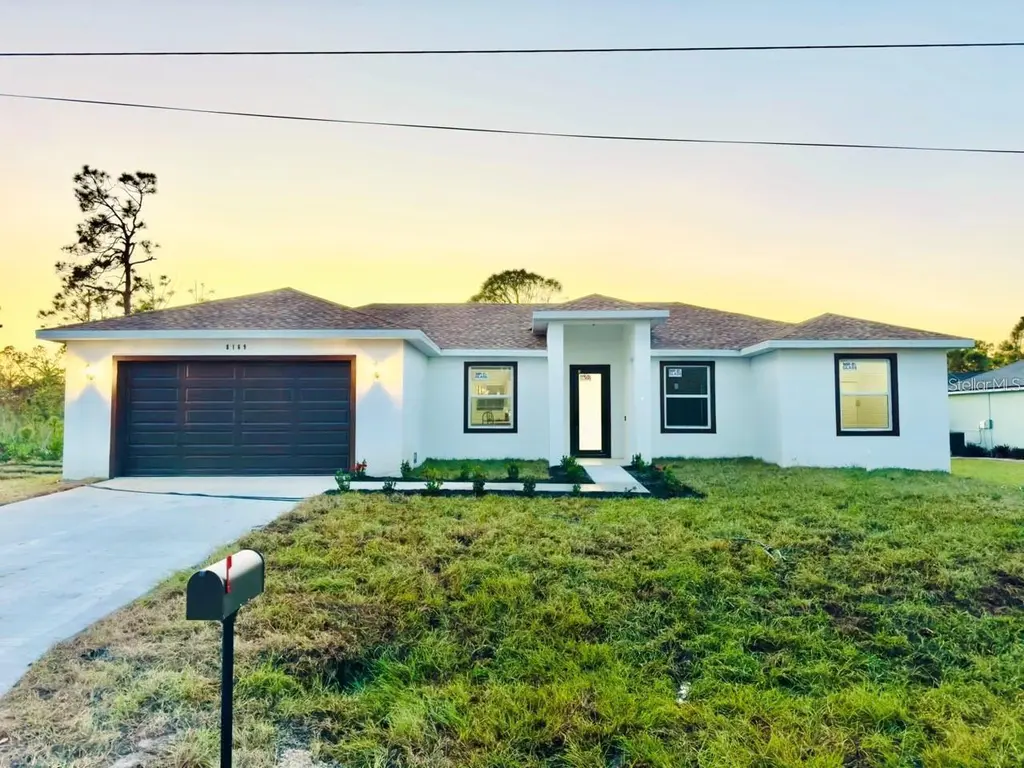
8169 Olsen St
Rotonda, FL 33981
$329,900F
4 bd · 2.0 ba ·
1,666 sqft ·
Built 2024
· Land
· Active
· 86 DOM
Cashflow @ list (25.0% down · 7.5%)
Estimated rent
$2,405/mo
Mortgage (P&I)
−$1,730
Tax + insurance
−$974
HOA
−$0
Vac / Maint / Mgmt
−$505
Net cashflow
$-804/mo
Annual
$-9,651/yr
Cap rate
4.92%
Cash-on-cash
-4.91%
DSCR
0.78
1% rule
0.73%
Cash to close
$92,372
Investor read
- This is a 4-bed/2.0-bath land listed at $330k.
- At list price, monthly cash flow is $-804 ($-10k/yr) — negative.
- To cash-flow at today's rent, offer at most $188k (43.1% below list).
- To meet the 1% rule (rent ≥ 1% of price), the offer needs to be $240k (27.1% below list).
- It's been on market 86 days — a 6% lower offer ($310k) is reasonable based on typical stale-listing flexibility.
- Recommended offer: $188k (43.1% below list) — sets the bar for cash-flow.
- Local home prices are declining (-3.0%/yr); year-one equity from $2k of loan paydown is wiped out by about $10k of value loss. Plan a longer hold.
- Location reads 67/100 on livability (#548 in FL) — a middle-class / working-renter tenant base. Strengths: crime A+, housing A-, cost of living B+; Watch: schools D, amenities F, commute F.
- Charlotte (suburban): math 54% / reading 54% proficiency, ranked #22 of 73 in FL (top 30%) — acceptable for families but not a draw, mixed tenant base, ~2y average lease.
- Watch-outs: flood insurance adds $427/mo.
- Market conditions: Rents rising fast (+5.3%/yr); 2188 active listings in the ZIP; 21 comparable units currently listed for rent nearby; rentals at typical pace (median 21d on market — plan ~3-4 weeks tenant-placement turnaround); solid renter incomes; 4,585 units permitted in Charlotte County in 2024 (703 in 5+ unit buildings).
- Charlotte County population projected at +24% by 2050 — long-run rental-demand tailwind backs the buy-and-hold thesis.
- 6 sale attempts since 21y ago; this cycle's ask is 8% above the opening price — seller raised mid-cycle; expect resistance to lowballs.
- Current owner paid $17k; list at $330k implies a 1841% gain — meaningful room to come down on a strong offer.
- Climate carrying-cost: in FEMA flood zone AE (mandatory federal flood insurance); severe wind risk, 99% chance of damaging wind over 30y; extreme-heat days projected 7→27/yr by 2055 (HVAC capex compounding) — expect insurance premiums to compound above CPI over the hold.
- Cap rate 4.9% vs local median 3.1% in Rotonda — top-decile yield for the area; either an underpriced asset or a hidden risk that comps aren't pricing in. Stress-test before assuming the spread holds.
- This rent runs 34% of the median local income ($84k/yr) — at the standard rent-burdened threshold; future hikes will face affordability resistance.
Questions for listing agent
- What do current leases actually rent for vs. the listed asking? Can we see a recent rent roll and the last 12 months of T-12 income?
- It's been on market 86 days. Have you received any prior offers? Is the seller open to a 43% concession, seller financing, or rate buy-down credit?
- What's the actual annual flood-insurance premium (NFIP or private), and is the property in a SFHA with mandatory coverage?
- Why hasn't it sold? Are there any deal-killer items the seller is aware of (foundation, flood, title, zoning, code violations)?
- Is there a deadline driving the sale (1031 exchange, divorce, estate, relocation)? That informs how much negotiation room exists.
- Schools are D-rated, which usually means shorter tenancies and higher turnover. Who's the typical renter profile here, and what's been the actual vacancy rate?
- The area grade is low — what's the realistic commute time and amenity access for the typical tenant pool here? Any planned neighborhood developments (good or bad) we should know about?
- What's the average days-on-market for RENTAL listings here right now (not sales)? A rising rental-DOM trend means longer vacancies and softer asking-rent achievability than the comps imply.
CashFlowRE · CFR-AQH71F4ASG33GP
· Data 2 days ago
cashflowre.app · 2026-05-29