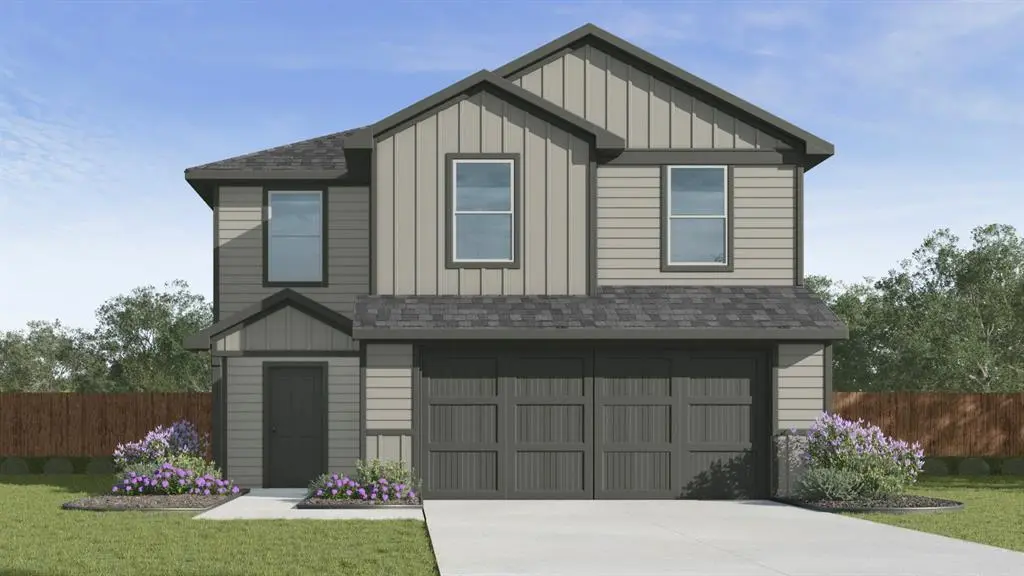
3534 Spring Time St
Forney, TX 75126
$246,990C
4 bd · 2.0 ba ·
1,470 sqft ·
Built 2026
· SingleFamily
· Active
· 27 DOM
Cashflow @ list (25.0% down · 7.5%)
Estimated rent
$2,372/mo
Mortgage (P&I)
−$1,295
Tax + insurance
−$412
HOA
−$42
Vac / Maint / Mgmt
−$498
Net cashflow
$125/mo
Annual
$1,498/yr
Cap rate
6.90%
Cash-on-cash
2.17%
DSCR
1.10
1% rule
0.96%
Cash to close
$69,157
Investor read
- This is a 4-bed/2.0-bath single-family listed at $247k. Condition is rated good.
- At list price, monthly cash flow is $125 ($1k/yr) — positive.
- The deal already cash-flows at list — no discount required.
- To meet the 1% rule (rent ≥ 1% of price), the offer needs to be $237k (4.0% below list).
- It's been on market 27 days — a 2% lower offer ($243k) is reasonable based on typical stale-listing flexibility.
- Recommended offer: $237k (4.0% below list) — sets the bar for 1% rule.
- Local home prices are declining (-3.0%/yr); year-one equity from $2k of loan paydown is wiped out by about $7k of value loss. Plan a longer hold.
- Location reads 76/100 on livability (#98 in TX, #3,339 nationally) — a middle-class / working-renter tenant base. Strengths: crime A+, employment A+, cost of living A+; Watch: amenities C-, commute F.
- Forney ISD (rural): math 41% / reading 44% proficiency, ranked #234 of 826 in TX (top 28%) — families likely to look elsewhere, expect single-tenant / working-renter base with shorter leases.
- Zoned schools: Willett El (725 students, 32% FRL).
- Market conditions: Rents rising (+1.4%/yr); 2179 active listings in the ZIP; 12 comparable units currently listed for rent nearby; rentals at typical pace (median 21d on market — plan ~3-4 weeks tenant-placement turnaround); solid renter incomes; 1,747 units permitted in Kaufman County in 2024 (180 in 5+ unit buildings).
- Kaufman County population projected at +43% by 2050 — long-run rental-demand tailwind backs the buy-and-hold thesis.
- Climate carrying-cost: major wind risk, 27% chance of damaging wind over 30y; moderate wildfire risk; extreme-heat days projected 7→24/yr by 2055 (HVAC capex compounding) — expect insurance premiums to compound above CPI over the hold.
- Cap rate 6.9% vs local median 4.1% in Forney — top-decile yield for the area; either an underpriced asset or a hidden risk that comps aren't pricing in. Stress-test before assuming the spread holds.
Questions for listing agent
- What does the HOA fee cover, when was the last increase, and are there any pending special assessments or reserve-fund shortfalls?
- Is there a deadline driving the sale (1031 exchange, divorce, estate, relocation)? That informs how much negotiation room exists.
- Schools are B-rated — typically a magnet for longer-tenancy family renters. What's the average tenant stay here, and is there a school-zone premium baked into asking?
- What's the average days-on-market for RENTAL listings here right now (not sales)? A rising rental-DOM trend means longer vacancies and softer asking-rent achievability than the comps imply.
- What's the recent tenant-quality profile in this submarket — average credit score on applications, eviction rate, late-payment / NSF rate, and stable-employment percentage? A property-management company in the area should have these aggregated.
- How much new for-sale + rental construction is in the pipeline within 1–3 miles? Heavy new supply typically softens prices + rents 12–24 months out; constrained supply supports both.
CashFlowRE · CFR-AVW4FHFC5ECC3D
· Data 2 days ago
cashflowre.app · 2026-05-29