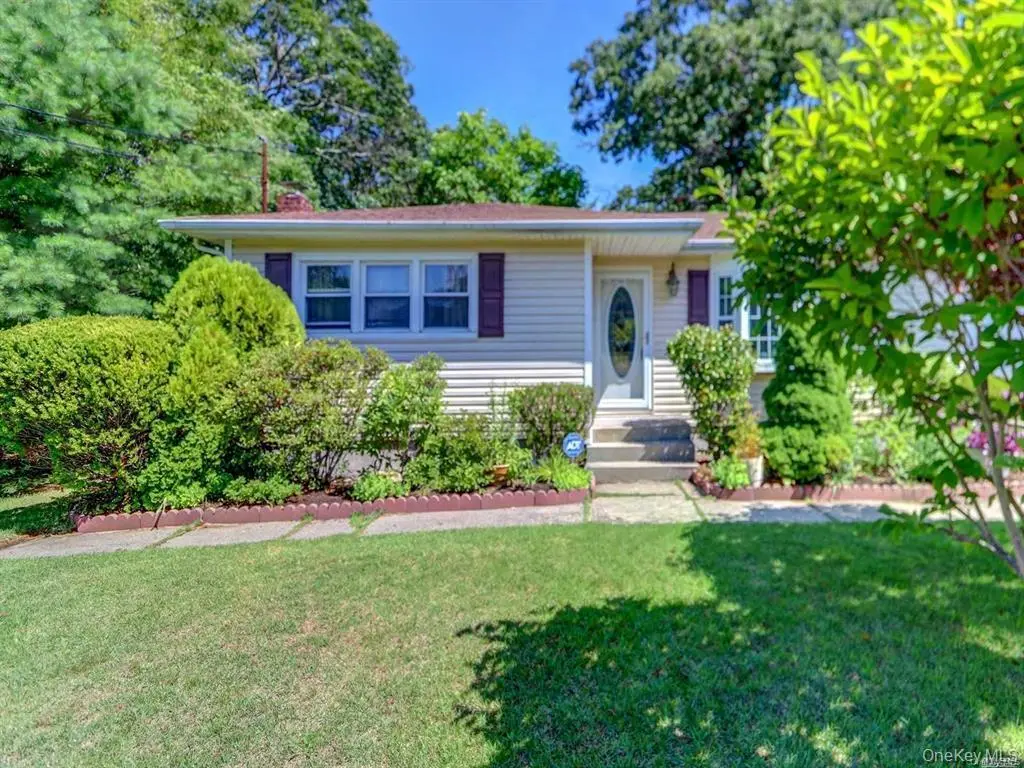
22 Teller Ave
Coram, NY 11727
$455,000D
3 bd · 1.0 ba ·
1,224 sqft ·
Built 1960
· SingleFamily
· Active
· 38 DOM
Cashflow @ list (25.0% down · 7.5%)
Estimated rent
$3,347/mo
Mortgage (P&I)
−$2,386
Tax + insurance
−$826
HOA
−$0
Vac / Maint / Mgmt
−$703
Net cashflow
$-568/mo
Annual
$-6,814/yr
Cap rate
4.80%
Cash-on-cash
-5.35%
DSCR
0.76
1% rule
0.74%
Cash to close
$127,400
Investor read
- This is a 3-bed/1.0-bath single-family listed at $455k.
- At list price, monthly cash flow is $-568 ($-7k/yr) — negative.
- To cash-flow at today's rent, offer at most $355k (22.0% below list).
- To meet the 1% rule (rent ≥ 1% of price), the offer needs to be $335k (26.4% below list).
- It's been on market 38 days — a 3% lower offer ($441k) is reasonable based on typical stale-listing flexibility.
- Recommended offer: $335k (26.4% below list) — sets the bar for 1% rule.
- Local home prices are declining (-3.0%/yr); year-one equity from $3k of loan paydown is wiped out by about $14k of value loss. Plan a longer hold.
- Location reads 66/100 on livability (#646 in NY) — a middle-class / working-renter tenant base. Strengths: employment A+, housing A+, schools B; Watch: amenities F, commute F, cost of living F.
- Longwood Central School District (rural): math 61% / reading 55% proficiency, ranked #235 of 590 in NY (top 40%) — acceptable for families but not a draw, mixed tenant base, ~2y average lease.
- Market conditions: Rents rising fast (+4.7%/yr); 232 active listings in the ZIP; 12 comparable units currently listed for rent nearby; rentals lingering (median 44d on market — plan ~5-8 weeks vacancy on turnover, expect pricing pressure); 75% of comp listings sitting > 30 days — soft ceiling on asking rent; solid renter incomes; 1,366 units permitted in Suffolk County in 2024 (216 in 5+ unit buildings).
- Suffolk County population projected to shrink 5% by 2050 — rents likely to lag national; underwrite the cash flow, not the appreciation.
- 3 sale attempts since 6y ago; this cycle's ask is 72% above the opening price — seller raised mid-cycle; expect resistance to lowballs.
- Current owner paid $290k; list at $455k implies a 57% gain — meaningful room to come down on a strong offer.
- Climate carrying-cost: major wind risk, 75% chance of damaging wind over 30y — expect insurance premiums to compound above CPI over the hold.
- Cap rate 4.8% vs local median 3.5% in Coram — top-decile yield for the area; either an underpriced asset or a hidden risk that comps aren't pricing in. Stress-test before assuming the spread holds.
- This rent runs 39% of the median local income ($103k/yr) — at the standard rent-burdened threshold; future hikes will face affordability resistance.
Questions for listing agent
- What do current leases actually rent for vs. the listed asking? Can we see a recent rent roll and the last 12 months of T-12 income?
- It's been on market 38 days. Have you received any prior offers? Is the seller open to a 26% concession, seller financing, or rate buy-down credit?
- Built in 1960 — when were the roof, HVAC, electrical panel, plumbing, and water heater last replaced?
- Is there a deadline driving the sale (1031 exchange, divorce, estate, relocation)? That informs how much negotiation room exists.
- Schools are B-rated — typically a magnet for longer-tenancy family renters. What's the average tenant stay here, and is there a school-zone premium baked into asking?
- The area grade is low — what's the realistic commute time and amenity access for the typical tenant pool here? Any planned neighborhood developments (good or bad) we should know about?
- What's the average days-on-market for RENTAL listings here right now (not sales)? A rising rental-DOM trend means longer vacancies and softer asking-rent achievability than the comps imply.
- What's the recent tenant-quality profile in this submarket — average credit score on applications, eviction rate, late-payment / NSF rate, and stable-employment percentage? A property-management company in the area should have these aggregated.
CashFlowRE · CFR-AYXKW15M47WNCT
· Data 5 days ago
cashflowre.app · 2026-05-29