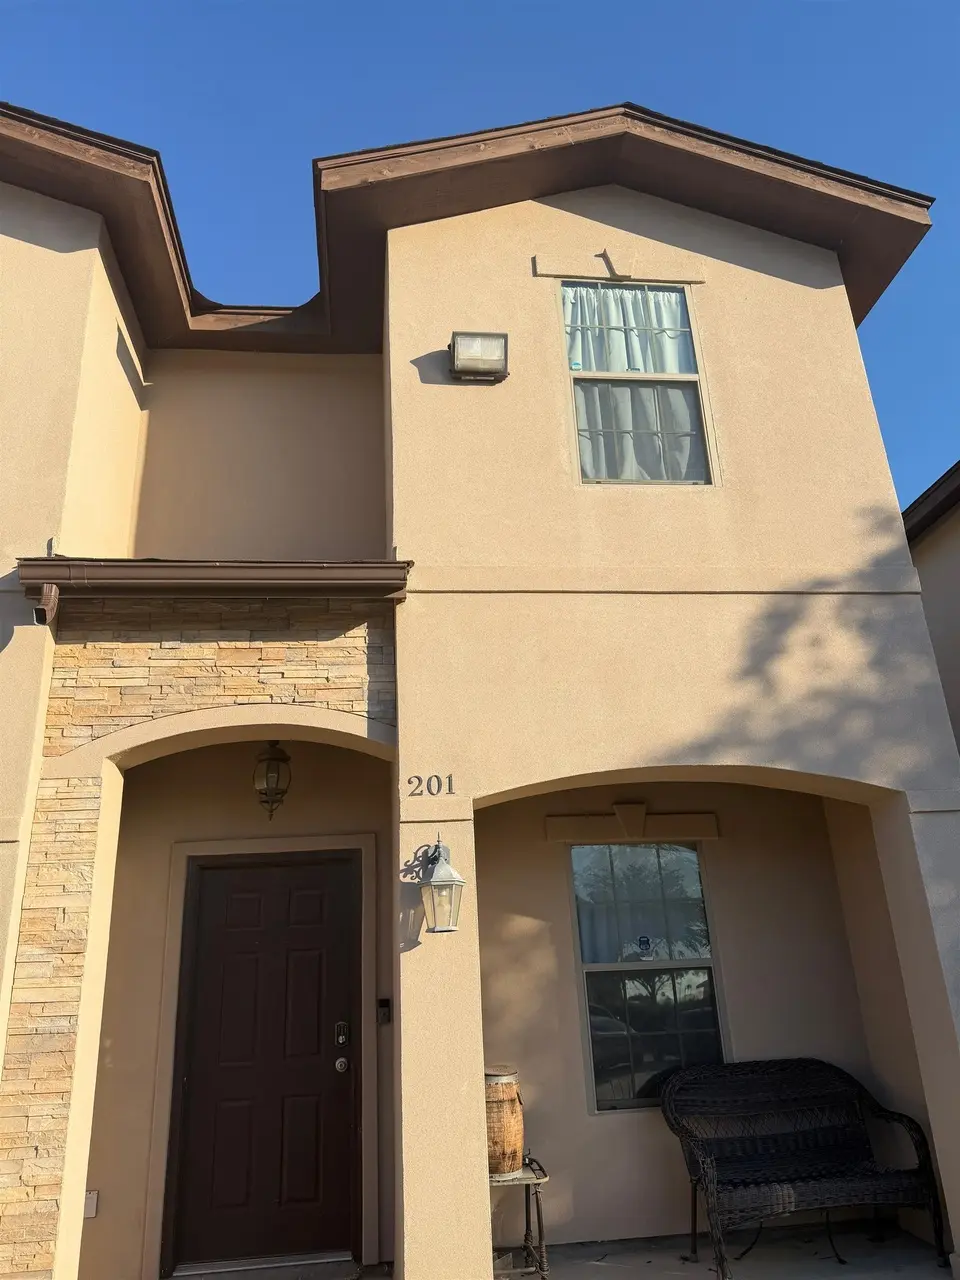
602 Basswood Dr #201
Laredo, TX 78045
$1,500D+
2 bd · 2.5 ba ·
1,100 sqft ·
Built 2015
· SingleFamily
· Active
· 14 DOM
Cashflow @ list (25.0% down · 7.5%)
Estimated rent
$1,365/mo
Mortgage (P&I)
−$8
Tax + insurance
−$2
HOA
−$0
Vac / Maint / Mgmt
−$287
Net cashflow
$1,068/mo
Annual
$12,812/yr
Cap rate
860.43%
Cash-on-cash
3050.50%
DSCR
136.73
1% rule
90.97%
Cash to close
$420
Investor read
- This is a 2-bed/2.5-bath single-family listed at $2k.
- At list price, monthly cash flow is $1k ($13k/yr) — positive.
- The deal already cash-flows at list — no discount required.
- Meets the 1% rule at list price ($1k rent vs $2k).
- Only 14 days on market — expect competitive offers; lowballing is unlikely to land.
- Local home prices are declining (-3.0%/yr); year-one equity from $10 of loan paydown is wiped out by about $45 of value loss. Plan a longer hold.
- Location reads 73/100 on livability (#227 in TX) — a middle-class / working-renter tenant base. Strengths: cost of living A+, housing A+, health & safety A+; Watch: crime C-, employment D+, amenities F.
- United ISD (urban): math 27% / reading 38% proficiency, ranked #568 of 826 in TX (top 69%) — families likely to look elsewhere, expect single-tenant / working-renter base with shorter leases; 72% free/reduced lunch — lower-income household profile, screen leases tightly.
- Zoned schools: Trautmann El (math 39% / reading 50%, grade F, #1,155 of 4,322 statewide, top 29%, 713 students, 60% FRL); Trautmann Middle (math 36% / reading 47%, grade F, #595 of 1,662 statewide, top 37%, 683 students, 63% FRL); United H S (math 36% / reading 59%, grade D, #583 of 1,632 statewide, top 36%, 3,644 students, 62% FRL).
- Zoned-school proficiency averages 44% at this address vs 32% district-wide (+12 pts) — the actual schools serving this property are materially stronger than the United ISD average implies; a family-tenant draw the district grade alone would hide.
- Market conditions: Rents rising fast (+4.7%/yr); 396 active listings in the ZIP; 32 comparable units currently listed for rent nearby; rentals lingering (median 46d on market — plan ~5-8 weeks vacancy on turnover, expect pricing pressure); 100% of comp listings sitting > 30 days — soft ceiling on asking rent; solid renter incomes; 1,448 units permitted in Webb County in 2024 (245 in 5+ unit buildings).
- Webb County population projected at +23% by 2050 — long-run rental-demand tailwind backs the buy-and-hold thesis.
- At projected returns (-3.0% appreciation + 4.7% rent growth), your $420 cash investment doubles in ~1 year — after that, you're playing with house money.
- Cap rate 860.4% vs local median 4.1% in Laredo — top-decile yield for the area; either an underpriced asset or a hidden risk that comps aren't pricing in. Stress-test before assuming the spread holds.
Questions for listing agent
- Is there a deadline driving the sale (1031 exchange, divorce, estate, relocation)? That informs how much negotiation room exists.
- The area grade is low — what's the realistic commute time and amenity access for the typical tenant pool here? Any planned neighborhood developments (good or bad) we should know about?
- What's the average days-on-market for RENTAL listings here right now (not sales)? A rising rental-DOM trend means longer vacancies and softer asking-rent achievability than the comps imply.
- What's the recent tenant-quality profile in this submarket — average credit score on applications, eviction rate, late-payment / NSF rate, and stable-employment percentage? A property-management company in the area should have these aggregated.
- How much new for-sale + rental construction is in the pipeline within 1–3 miles? Heavy new supply typically softens prices + rents 12–24 months out; constrained supply supports both.
CashFlowRE · CFR-AZ5WXRBD31KDHY
· Data 1 week ago
cashflowre.app · 2026-05-29