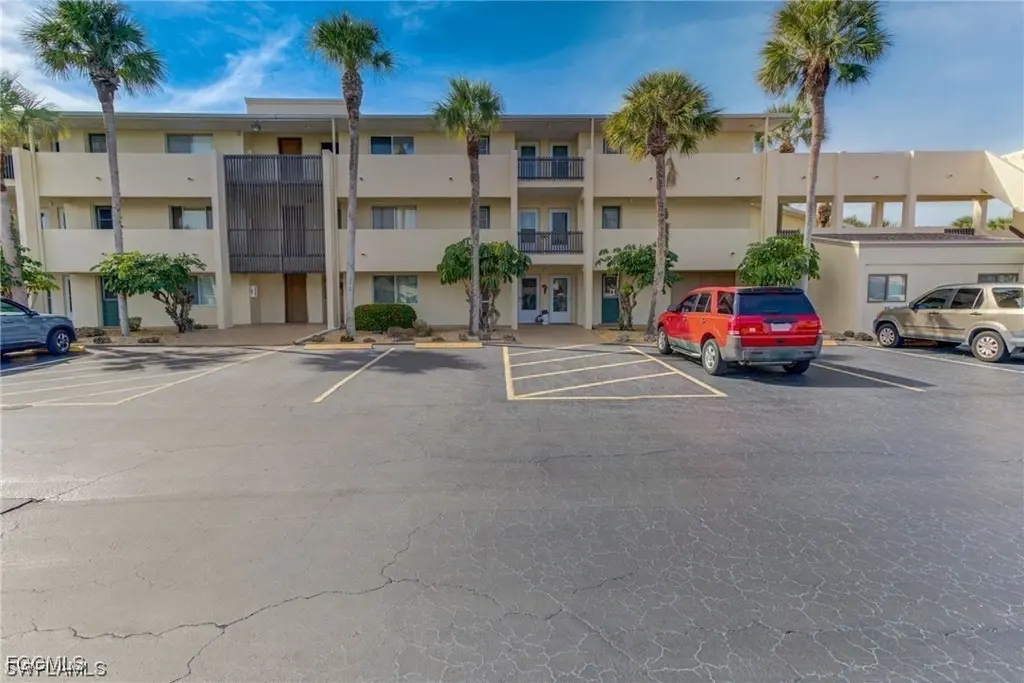
333 Joel Blvd #138
Lehigh Acres, FL 33936
$130,000D
2 bd · 1.0 ba ·
877 sqft ·
Built 1971
· Condo
· Active
· 37 DOM
Cashflow @ list (25.0% down · 7.5%)
Estimated rent
$1,325/mo
Mortgage (P&I)
−$682
Tax + insurance
−$169
HOA
−$220
Vac / Maint / Mgmt
−$278
Net cashflow
$-24/mo
Annual
$-288/yr
Cap rate
6.07%
Cash-on-cash
-0.79%
DSCR
0.96
1% rule
1.02%
Cash to close
$36,400
Investor read
- This is a 2-bed/1.0-bath condo listed at $130k.
- At list price, monthly cash flow is $-24 ($-288/yr) — negative.
- To cash-flow at today's rent, offer at most $126k (3.3% below list).
- Meets the 1% rule at list price ($1k rent vs $130k).
- It's been on market 37 days — a 3% lower offer ($126k) is reasonable based on typical stale-listing flexibility.
- Recommended offer: $126k (3.3% below list) — sets the bar for cash-flow.
- Local home prices are declining (-3.0%/yr); year-one equity from $899 of loan paydown is wiped out by about $4k of value loss. Plan a longer hold.
- Location reads 59/100 on livability (#826 in FL) — a working-class tenant base; expect higher turnover. Strengths: cost of living A+, housing A+; Watch: crime C-, employment D+, schools D-.
- Lee (suburban): math 47% / reading 50% proficiency, ranked #42 of 73 in FL (top 58%) — families likely to look elsewhere, expect single-tenant / working-renter base with shorter leases.
- Market conditions: Rents soft (-0.8%/yr); 641 active listings in the ZIP; 9 comparable units currently listed for rent nearby; rentals at typical pace (median 24d on market — plan ~3-4 weeks tenant-placement turnaround); 15,411 units permitted in Lee County in 2024 (4,686 in 5+ unit buildings).
- Lee County population projected at +44% by 2050 — long-run rental-demand tailwind backs the buy-and-hold thesis.
- 5 sale attempts since 3y ago; this cycle's ask is 12965% above the opening price — seller raised mid-cycle; expect resistance to lowballs.
- Climate carrying-cost: severe wind risk, 99% chance of damaging wind over 30y; extreme-heat days projected 7→29/yr by 2055 (HVAC capex compounding) — expect insurance premiums to compound above CPI over the hold.
- Cap rate 6.1% vs local median 4.7% in Lehigh Acres — meaningfully above typical; check what's discounted (condition, days-on-market, listing class) to confirm the premium yield is real.
- This rent runs 31% of the median local income ($51k/yr) — at the standard rent-burdened threshold; future hikes will face affordability resistance.
Questions for listing agent
- What do current leases actually rent for vs. the listed asking? Can we see a recent rent roll and the last 12 months of T-12 income?
- It's been on market 37 days. Have you received any prior offers? Is the seller open to a 3% concession, seller financing, or rate buy-down credit?
- Built in 1971 — when were the roof, HVAC, electrical panel, plumbing, and water heater last replaced?
- What does the HOA fee cover, when was the last increase, and are there any pending special assessments or reserve-fund shortfalls?
- Any open or pending special assessments — roof, HVAC, plumbing, elevator, façade? What's the per-unit balance and payoff schedule, and is the seller paying it off at close or rolling it to the buyer?
- Is there a deadline driving the sale (1031 exchange, divorce, estate, relocation)? That informs how much negotiation room exists.
- Schools are D-rated, which usually means shorter tenancies and higher turnover. Who's the typical renter profile here, and what's been the actual vacancy rate?
- The area grade is low — what's the realistic commute time and amenity access for the typical tenant pool here? Any planned neighborhood developments (good or bad) we should know about?
CashFlowRE · CFR-B0BT001XAPCDQP
· Data 3 days ago
cashflowre.app · 2026-05-29