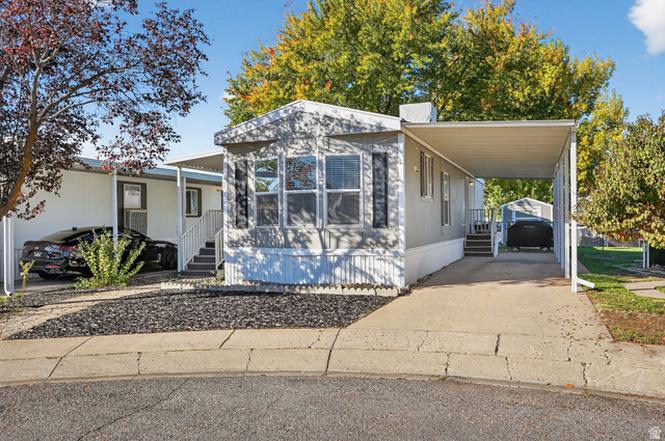
935 E 3000 N #26
Layton, UT 84040
$39,900F
2 bd · 1.0 ba ·
900 sqft ·
Built 2000
· Manufactured
· Active
· 137 DOM
Cashflow @ list (25.0% down · 7.5%)
Estimated rent
$1,370/mo
Mortgage (P&I)
−$209
Tax + insurance
−$66
HOA
−$1,022
Vac / Maint / Mgmt
−$288
Net cashflow
$-215/mo
Annual
$-2,581/yr
Cap rate
-0.18%
Cash-on-cash
-23.10%
DSCR
-0.03
1% rule
3.43%
Cash to close
$11,172
Investor read
- This is a 2-bed/1.0-bath manufactured listed at $40k.
- At list price, monthly cash flow is $-215 ($-3k/yr) — negative.
- To cash-flow at today's rent, offer at most $9k (78.0% below list).
- Meets the 1% rule at list price ($1k rent vs $40k).
- It's been on market 137 days — a 12% lower offer ($35k) is reasonable based on typical stale-listing flexibility.
- Recommended offer: $9k (78.0% below list) — sets the bar for cash-flow.
- Local home prices are declining (-3.0%/yr); year-one equity from $276 of loan paydown is wiped out by about $1k of value loss. Plan a longer hold.
- Location reads 86/100 on livability (#11 in UT, #457 nationally) — a professional / high-income tenant draw. Strengths: commute A+, employment A+, housing A+.
- Davis District (suburban): math 43% / reading 47% proficiency, ranked #28 of 80 in UT (top 35%) — families likely to look elsewhere, expect single-tenant / working-renter base with shorter leases; only 19% free/reduced lunch — higher-income household profile.
- Zoned schools: Mountain View School (math 50% / reading 50%, grade D+, #161 of 585 statewide, top 29%, 781 students, 21% FRL); North Layton Jr High (math 39% / reading 40%, grade F, #75 of 138 statewide, top 56%, 1,009 students, 30% FRL); Northridge High (math 24% / reading 43%, grade F, #106 of 171 statewide, top 62%, 1,954 students, 23% FRL).
- Watch-outs: HOA is 75% of rent.
- Market conditions: 187 active listings in the ZIP; 5 comparable units currently listed for rent nearby; rentals at typical pace (median 17d on market — plan ~3-4 weeks tenant-placement turnaround); high-income renter base; 1,461 units permitted in Davis County in 2024 (508 in 5+ unit buildings).
- Davis County population projected at +39% by 2050 — long-run rental-demand tailwind backs the buy-and-hold thesis.
- 4 sale attempts since 3y ago with the ask held roughly flat each time — persistent listings suggest the price (not the market) is what's stuck; bring a comps-based counter.
- Climate carrying-cost: moderate flood risk; major wildfire risk — expect insurance premiums to compound above CPI over the hold.
- This rent is only 13% of the median local income ($128k/yr) — well below the 30% rent-burden line; pricing power to push rent on renewal without tenant pushback.
Questions for listing agent
- What do current leases actually rent for vs. the listed asking? Can we see a recent rent roll and the last 12 months of T-12 income?
- It's been on market 137 days. Have you received any prior offers? Is the seller open to a 78% concession, seller financing, or rate buy-down credit?
- What does the HOA fee cover, when was the last increase, and are there any pending special assessments or reserve-fund shortfalls?
- Why hasn't it sold? Are there any deal-killer items the seller is aware of (foundation, flood, title, zoning, code violations)?
- Is there a deadline driving the sale (1031 exchange, divorce, estate, relocation)? That informs how much negotiation room exists.
- Schools are B-rated — typically a magnet for longer-tenancy family renters. What's the average tenant stay here, and is there a school-zone premium baked into asking?
- The area grade is low — what's the realistic commute time and amenity access for the typical tenant pool here? Any planned neighborhood developments (good or bad) we should know about?
- What's the average days-on-market for RENTAL listings here right now (not sales)? A rising rental-DOM trend means longer vacancies and softer asking-rent achievability than the comps imply.
CashFlowRE · CFR-B1E389BMJ8T22E
· Data 4 h ago
cashflowre.app · 2026-05-29