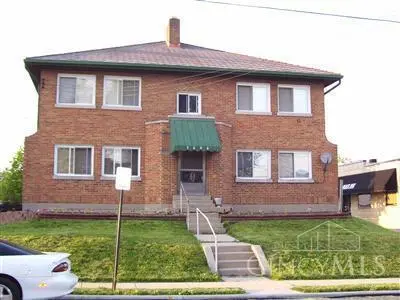
3606 Gamble Ave
Cheviot, OH 45211
$365,000C+
16 bd · 16.0 ba ·
— sqft ·
Built 1935
· MultiFamily
· Active
· 59 DOM
Cashflow @ list (25.0% down · 7.5%)
Estimated rent
$4,398/mo
Mortgage (P&I)
−$1,914
Tax + insurance
−$679
HOA
−$0
Vac / Maint / Mgmt
−$924
Net cashflow
$881/mo
Annual
$10,576/yr
Cap rate
9.19%
Cash-on-cash
10.35%
DSCR
1.46
1% rule
1.20%
Cash to close
$102,200
Investor read
- This is a 4 × 2-bed/1-bath units multifamily listed at $365k.
- At list price, monthly cash flow is $881 ($11k/yr) — positive. Per door: $220/mo.
- The deal already cash-flows at list — no discount required.
- Meets the 1% rule at list price ($4k rent vs $365k).
- It's been on market 59 days — a 3% lower offer ($354k) is reasonable based on typical stale-listing flexibility.
- Recommended offer: $354k (3.0% below list) — sets the bar for market timing.
- Local home prices are declining (-3.0%/yr); year-one equity from $3k of loan paydown is wiped out by about $11k of value loss. Plan a longer hold.
- Location reads 78/100 on livability (#163 in OH, #2,446 nationally) — a middle-class / working-renter tenant base. Strengths: commute A+, cost of living A+, housing A+; Watch: crime C-, amenities D, employment F.
- Cincinnati Public Schools (urban): math 25% / reading 36% proficiency, ranked #581 of 656 in OH (top 89%) — families likely to look elsewhere, expect single-tenant / working-renter base with shorter leases; 70% free/reduced lunch — lower-income household profile, screen leases tightly.
- Watch-outs: built in 1935 — expect roof / HVAC / electrical / plumbing capex.
- Market conditions: Rents rising (+3.6%/yr); 82 active listings in the ZIP; 801 units permitted in Hamilton County in 2024 (190 in 5+ unit buildings).
- 7 sale attempts since 18y ago; this cycle's ask has dropped $20k (5%) from the opening price — seller is motivated, your offer sets the floor, not the list.
- Current owner paid $125k; list at $365k implies a 192% gain — meaningful room to come down on a strong offer.
- At projected returns (-3.0% appreciation + 3.6% rent growth), your $102k cash investment doubles in ~10 years — after that, you're playing with house money.
- Cap rate 9.2% vs local median 5.1% in Cheviot — top-decile yield for the area; either an underpriced asset or a hidden risk that comps aren't pricing in. Stress-test before assuming the spread holds.
- At $4,398/mo this rent would consume 98% of the median local household income ($54k/yr) (locally 1916% of renters already pay >50% of income on rent) — very limited rent-growth headroom before tenants either downsize or default.
Questions for listing agent
- It's been on market 59 days. Have you received any prior offers? Is the seller open to a 3% concession, seller financing, or rate buy-down credit?
- Can we see the unit-by-unit rent roll, current vacancy, and any below-market leases? What's the average tenancy length?
- What capital expenditures (roof, boiler, parking lot, exteriors) have been made in the last 5 years, and what's planned in the next 2?
- Built in 1935 — when were the roof, HVAC, electrical panel, plumbing, and water heater last replaced?
- Is there a deadline driving the sale (1031 exchange, divorce, estate, relocation)? That informs how much negotiation room exists.
- What's the average days-on-market for RENTAL listings here right now (not sales)? A rising rental-DOM trend means longer vacancies and softer asking-rent achievability than the comps imply.
- What's the recent tenant-quality profile in this submarket — average credit score on applications, eviction rate, late-payment / NSF rate, and stable-employment percentage? A property-management company in the area should have these aggregated.
- How much new apartment / multifamily construction is in the pipeline within 1–3 miles? Heavy new supply (>2% of stock underway) typically softens rents 12–24 months out; light construction supports rent growth.
CashFlowRE · CFR-B3EC9ZAVK5RTHS
· Data 2 days ago
cashflowre.app · 2026-05-29