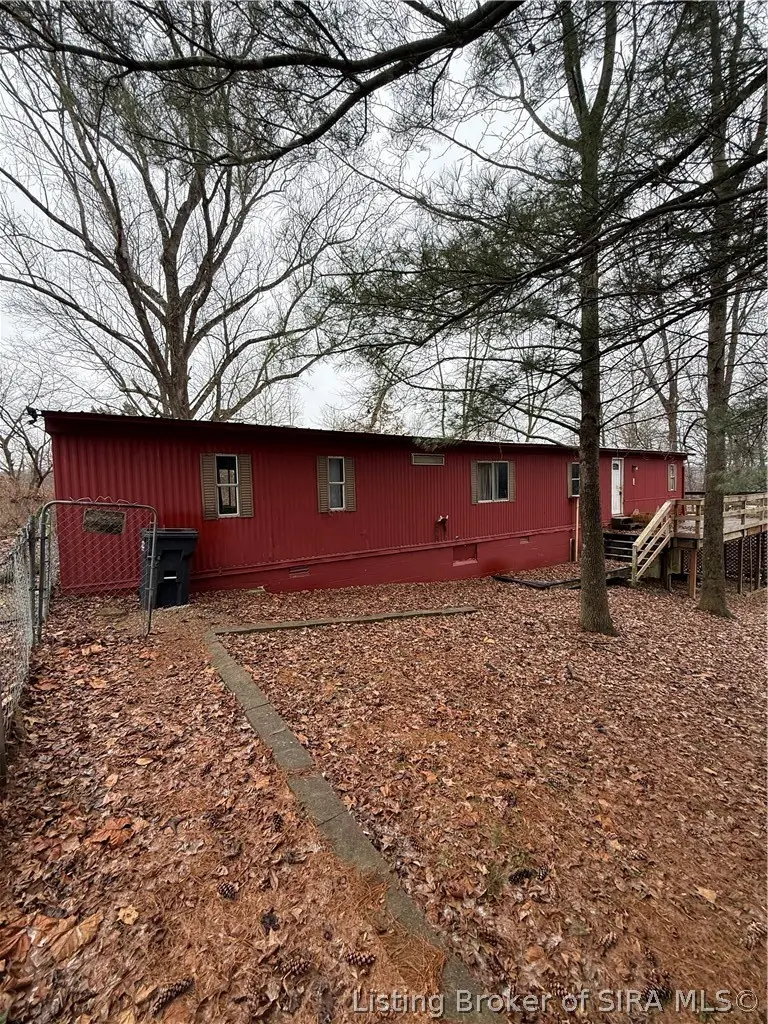
1831 Hylander Dr
Country Squire Lakes, IN 47265
$89,000B+
3 bd · 1.0 ba ·
938 sqft ·
Built 1987
· Manufactured
· Active
· 84 DOM
Cashflow @ list (25.0% down · 7.5%)
Estimated rent
$1,335/mo
Mortgage (P&I)
−$467
Tax + insurance
−$148
HOA
−$0
Vac / Maint / Mgmt
−$280
Net cashflow
$440/mo
Annual
$5,279/yr
Cap rate
12.22%
Cash-on-cash
21.18%
DSCR
1.94
1% rule
1.50%
Cash to close
$24,920
Investor read
- This is a 3-bed/1.0-bath manufactured listed at $89k.
- At list price, monthly cash flow is $440 ($5k/yr) — positive.
- The deal already cash-flows at list — no discount required.
- Meets the 1% rule at list price ($1k rent vs $89k).
- It's been on market 84 days — a 6% lower offer ($84k) is reasonable based on typical stale-listing flexibility.
- Recommended offer: $84k (6.0% below list) — sets the bar for market timing.
- Local home prices are declining (-3.0%/yr); year-one equity from $615 of loan paydown is wiped out by about $3k of value loss. Plan a longer hold.
- Location reads 59/100 on livability (#566 in IN) — a working-class tenant base; expect higher turnover. Strengths: cost of living A+, housing A+, crime A-; Watch: health & safety D, amenities F, commute F.
- Jennings County School Corporation (rural): math 32% / reading 38% proficiency, ranked #194 of 301 in IN (top 64%) — families likely to look elsewhere, expect single-tenant / working-renter base with shorter leases.
- Zoned schools: Sand Creek Elementary School (math 33% / reading 29%, grade F, #682 of 994 statewide, top 69%, 389 students, 85% FRL); Jennings County Middle School (math 28% / reading 36%, grade F, #190 of 330 statewide, top 59%, 626 students, 62% FRL); Jennings County High School (math 26% / reading 62%, grade F, #189 of 369 statewide, top 51%, 1,184 students, 52% FRL) — zoned schools average 66% FRL vs 49% district-wide (18 pts higher); higher-poverty schools than district average — tighter screening recommended.
- Market conditions: 160 active listings in the ZIP; 84 units permitted in Jennings County in 2024 (0 in 5+ unit buildings).
- Jennings County population projected at -21% by 2050 — secular population decline; favor cash flow + early exit over multi-decade hold.
- 2 sale attempts with the ask held roughly flat each time — persistent listings suggest the price (not the market) is what's stuck; bring a comps-based counter.
- At projected returns (-3.0% appreciation + 3.0% rent growth), your $25k cash investment doubles in ~6 years — after that, you're playing with house money.
- Cap rate 12.2% vs local median 6.0% in Country Squire Lakes — top-decile yield for the area; either an underpriced asset or a hidden risk that comps aren't pricing in. Stress-test before assuming the spread holds.
Questions for listing agent
- It's been on market 84 days. Have you received any prior offers? Is the seller open to a 6% concession, seller financing, or rate buy-down credit?
- Why hasn't it sold? Are there any deal-killer items the seller is aware of (foundation, flood, title, zoning, code violations)?
- Is there a deadline driving the sale (1031 exchange, divorce, estate, relocation)? That informs how much negotiation room exists.
- Schools are F-rated, which usually means shorter tenancies and higher turnover. Who's the typical renter profile here, and what's been the actual vacancy rate?
- What's the average days-on-market for RENTAL listings here right now (not sales)? A rising rental-DOM trend means longer vacancies and softer asking-rent achievability than the comps imply.
- What's the recent tenant-quality profile in this submarket — average credit score on applications, eviction rate, late-payment / NSF rate, and stable-employment percentage? A property-management company in the area should have these aggregated.
- How much new for-sale + rental construction is in the pipeline within 1–3 miles? Heavy new supply typically softens prices + rents 12–24 months out; constrained supply supports both.
CashFlowRE · CFR-B4KVEE3QHQW8KS
· Data 2 days ago
cashflowre.app · 2026-05-29