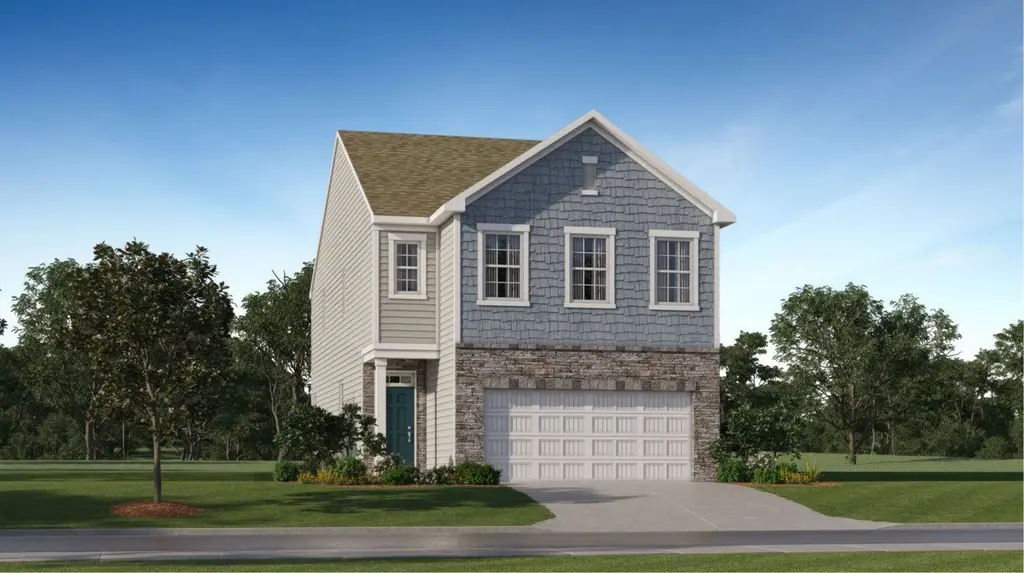
793 Ben Gunn Run
Gilbert, SC 29054
$243,459C-
3 bd · 2.5 ba ·
1,928 sqft ·
Built 2026
· SingleFamily
· Active
· 9 DOM
Cashflow @ list (25.0% down · 7.5%)
Estimated rent
$1,999/mo
Mortgage (P&I)
−$1,277
Tax + insurance
−$406
HOA
−$0
Vac / Maint / Mgmt
−$420
Net cashflow
$-103/mo
Annual
$-1,238/yr
Cap rate
5.78%
Cash-on-cash
-1.82%
DSCR
0.92
1% rule
0.82%
Cash to close
$68,169
Investor read
- This is a 3-bed/2.5-bath single-family listed at $243k. Condition is rated excellent.
- At list price, monthly cash flow is $-103 ($-1k/yr) — negative.
- To cash-flow at today's rent, offer at most $229k (6.1% below list).
- To meet the 1% rule (rent ≥ 1% of price), the offer needs to be $200k (17.9% below list).
- Only 9 days on market — expect competitive offers; lowballing is unlikely to land.
- Recommended offer: $200k (17.9% below list) — sets the bar for 1% rule.
- In year one you build about $26k of equity ($2k loan paydown + $24k appreciation (10.0% local appreciation)).
- Location reads 71/100 on livability (#52 in SC) — a middle-class / working-renter tenant base. Strengths: cost of living A+, housing A+, crime B; Watch: schools D, amenities F, commute F.
- Lexington 01 (suburban): math 42% / reading 53% proficiency, ranked #11 of 80 in SC (top 14%) — families likely to look elsewhere, expect single-tenant / working-renter base with shorter leases.
- Market conditions: 273 active listings in the ZIP; 2 comparable units currently listed for rent nearby; 1,712 units permitted in Lexington County in 2024 (0 in 5+ unit buildings).
- Lexington County population projected at +26% by 2050 — long-run rental-demand tailwind backs the buy-and-hold thesis.
- By year 2, paydown + projected appreciation supports a ~$42k cash-out refi (75% LTV) — recoverable capital for the next deal without selling this one.
Questions for listing agent
- What do current leases actually rent for vs. the listed asking? Can we see a recent rent roll and the last 12 months of T-12 income?
- Is there a deadline driving the sale (1031 exchange, divorce, estate, relocation)? That informs how much negotiation room exists.
- Schools are D-rated, which usually means shorter tenancies and higher turnover. Who's the typical renter profile here, and what's been the actual vacancy rate?
- What's the average days-on-market for RENTAL listings here right now (not sales)? A rising rental-DOM trend means longer vacancies and softer asking-rent achievability than the comps imply.
- What's the recent tenant-quality profile in this submarket — average credit score on applications, eviction rate, late-payment / NSF rate, and stable-employment percentage? A property-management company in the area should have these aggregated.
- How much new for-sale + rental construction is in the pipeline within 1–3 miles? Heavy new supply typically softens prices + rents 12–24 months out; constrained supply supports both.
CashFlowRE · CFR-B5681A4ABZYXNE
· Data 3 days ago
cashflowre.app · 2026-05-29