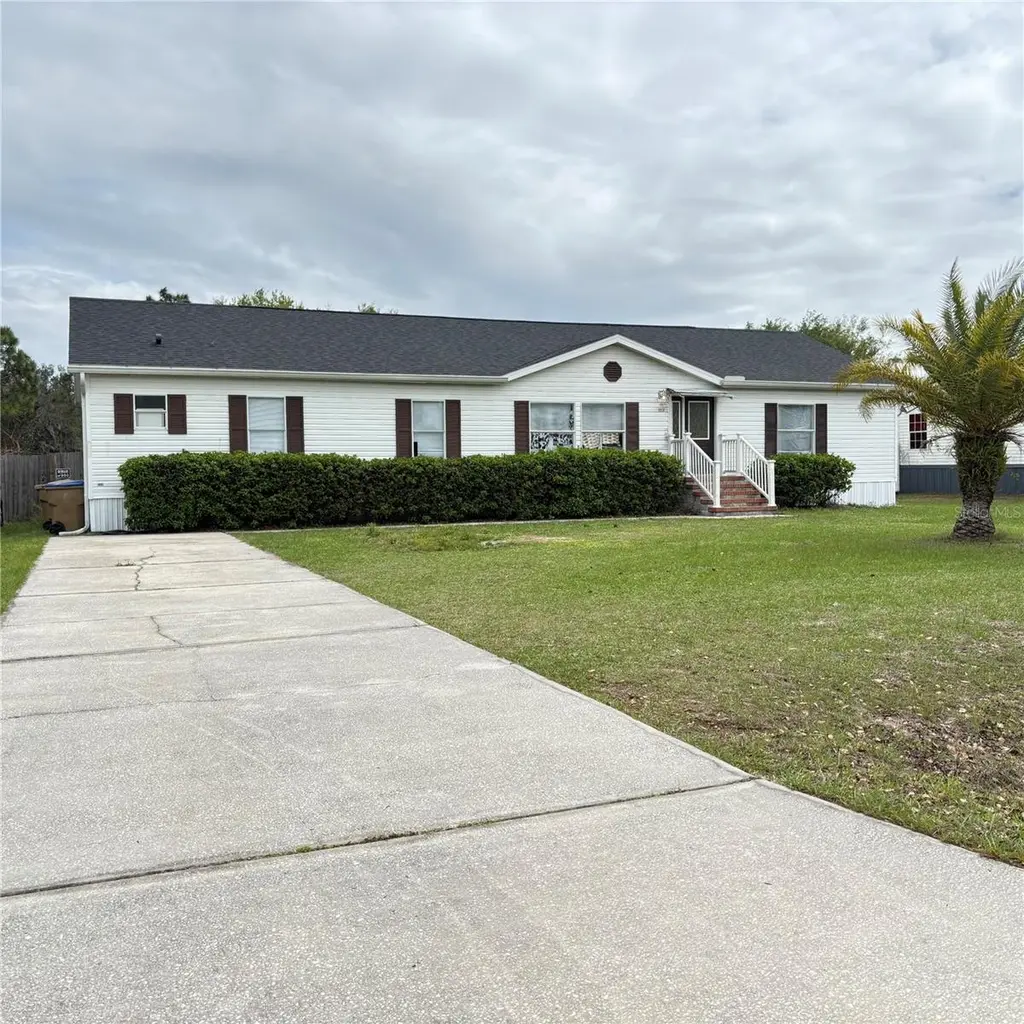
1813 Winchester Ct S
St. Cloud, FL 34771
$250,000D
3 bd · 2.0 ba ·
2,010 sqft ·
Built 2000
· Manufactured
· Pending
· 3 DOM
Cashflow @ list (25.0% down · 7.5%)
Estimated rent
$2,546/mo
Mortgage (P&I)
−$1,311
Tax + insurance
−$451
HOA
−$6
Vac / Maint / Mgmt
−$535
Net cashflow
$244/mo
Annual
$2,923/yr
Cap rate
7.46%
Cash-on-cash
4.18%
DSCR
1.19
1% rule
1.02%
Cash to close
$70,000
Investor read
- This is a 3-bed/2.0-bath manufactured listed at $250k.
- At list price, monthly cash flow is $244 ($3k/yr) — positive.
- The deal already cash-flows at list — no discount required.
- Meets the 1% rule at list price ($3k rent vs $250k).
- Only 3 days on market — expect competitive offers; lowballing is unlikely to land.
- Local home prices are declining (-3.0%/yr); year-one equity from $2k of loan paydown is wiped out by about $8k of value loss. Plan a longer hold.
- Location reads: area grade D — affects rentability + tenant quality, not the cash-flow math above.
- Osceola (suburban): math 39% / reading 45% proficiency, ranked #60 of 73 in FL (top 82%) — families likely to look elsewhere, expect single-tenant / working-renter base with shorter leases; 60% free/reduced lunch — lower-income household profile, screen leases tightly.
- Zoned schools: Hickory Tree Elementary School (math 64% / reading 59%, grade B, #634 of 2,144 statewide, top 30%, 795 students, 48% FRL); Harmony High School (math 40% / reading 46%, grade F, #255 of 667 statewide, top 39%, 2,822 students, 42% FRL) — zoned schools average 45% FRL vs 60% district-wide (15 pts lower); this property's tenant base skews higher-income than the district average.
- Market conditions: Rents rising (+3.0%/yr); 1378 active listings in the ZIP; 14 comparable units currently listed for rent nearby; rentals at typical pace (median 15d on market — plan ~3-4 weeks tenant-placement turnaround); solid renter incomes; 8,813 units permitted in Osceola County in 2024 (3,072 in 5+ unit buildings).
- Osceola County population projected at +73% by 2050 — long-run rental-demand tailwind backs the buy-and-hold thesis.
- 2 sale attempts since 2y ago with the ask held roughly flat each time — persistent listings suggest the price (not the market) is what's stuck; bring a comps-based counter.
- Climate carrying-cost: severe wind risk, 99% chance of damaging wind over 30y; major wildfire risk; extreme-heat days projected 7→24/yr by 2055 (HVAC capex compounding) — expect insurance premiums to compound above CPI over the hold.
- Cap rate 7.5% vs local median 4.0% in St. Cloud — top-decile yield for the area; either an underpriced asset or a hidden risk that comps aren't pricing in. Stress-test before assuming the spread holds.
- This rent runs 31% of the median local income ($97k/yr) — at the standard rent-burdened threshold; future hikes will face affordability resistance.
Questions for listing agent
- What does the HOA fee cover, when was the last increase, and are there any pending special assessments or reserve-fund shortfalls?
- Is there a deadline driving the sale (1031 exchange, divorce, estate, relocation)? That informs how much negotiation room exists.
- The area grade is low — what's the realistic commute time and amenity access for the typical tenant pool here? Any planned neighborhood developments (good or bad) we should know about?
- What's the average days-on-market for RENTAL listings here right now (not sales)? A rising rental-DOM trend means longer vacancies and softer asking-rent achievability than the comps imply.
- What's the recent tenant-quality profile in this submarket — average credit score on applications, eviction rate, late-payment / NSF rate, and stable-employment percentage? A property-management company in the area should have these aggregated.
- How much new for-sale + rental construction is in the pipeline within 1–3 miles? Heavy new supply typically softens prices + rents 12–24 months out; constrained supply supports both.
CashFlowRE · CFR-B5RT25485ZBT5M
· Data 3 weeks ago
cashflowre.app · 2026-05-29