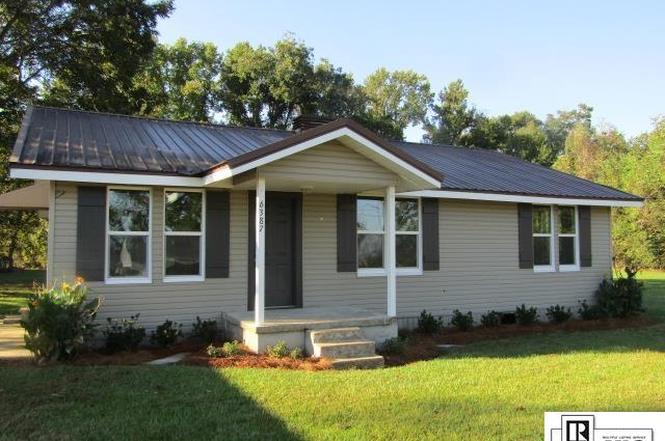
6387 Highway 80
Start, LA 71269
$185,000C
2 bd · 1.0 ba ·
1,388 sqft ·
Built —
· SingleFamily
· Pending
· 182 DOM
Cashflow @ list (25.0% down · 7.5%)
Estimated rent
$2,194/mo
Mortgage (P&I)
−$970
Tax + insurance
−$308
HOA
−$0
Vac / Maint / Mgmt
−$461
Net cashflow
$455/mo
Annual
$5,459/yr
Cap rate
9.24%
Cash-on-cash
10.54%
DSCR
1.47
1% rule
1.19%
Cash to close
$51,800
Investor read
- This is a 2-bed/1.0-bath single-family listed at $185k.
- At list price, monthly cash flow is $455 ($5k/yr) — positive.
- The deal already cash-flows at list — no discount required.
- Meets the 1% rule at list price ($2k rent vs $185k).
- It's been on market 182 days — a 12% lower offer ($163k) is reasonable based on typical stale-listing flexibility.
- Recommended offer: $163k (12.0% below list) — sets the bar for market timing.
- Local home prices are declining (-3.0%/yr); year-one equity from $1k of loan paydown is wiped out by about $6k of value loss. Plan a longer hold.
- Location reads 59/100 on livability (#279 in LA) — a working-class tenant base; expect higher turnover. Strengths: cost of living A+; Watch: health & safety D, crime F, amenities F.
- Richland Parish (rural): math 12% / reading 22% proficiency, ranked #73 of 98 in LA (top 74%) — low school quality limits family demand, transient renter base, plan for 1-2y turnover; 76% free/reduced lunch — lower-income household profile, screen leases tightly.
- Zoned schools: Start Elementary School (math 12% / reading 17%, grade F, #516 of 646 statewide, top 82%, 318 students, 56% FRL); Mangham Junior High School (math 19% / reading 35%, grade F, #132 of 218 statewide, top 61%, 211 students, 52% FRL) — zoned schools average 54% FRL vs 76% district-wide (22 pts lower); this property's tenant base skews higher-income than the district average.
- Market conditions: 100 active listings in the ZIP; 27 units permitted in Richland Parish in 2024 (0 in 5+ unit buildings).
- Richland County population projected to shrink 9% by 2050 — rents likely to lag national; underwrite the cash flow, not the appreciation.
- 2 sale attempts with the ask held roughly flat each time — persistent listings suggest the price (not the market) is what's stuck; bring a comps-based counter.
- Climate carrying-cost: severe wind risk, 80% chance of damaging wind over 30y; extreme-heat days projected 7→20/yr by 2055 (HVAC capex compounding) — expect insurance premiums to compound above CPI over the hold.
Questions for listing agent
- It's been on market 182 days. Have you received any prior offers? Is the seller open to a 12% concession, seller financing, or rate buy-down credit?
- Why hasn't it sold? Are there any deal-killer items the seller is aware of (foundation, flood, title, zoning, code violations)?
- Is there a deadline driving the sale (1031 exchange, divorce, estate, relocation)? That informs how much negotiation room exists.
- Crime grade is F in this area — have there been break-ins, vandalism, or insurance claims at this property in the last 3 years? What carrier currently insures it and at what premium?
- What's the average days-on-market for RENTAL listings here right now (not sales)? A rising rental-DOM trend means longer vacancies and softer asking-rent achievability than the comps imply.
- What's the recent tenant-quality profile in this submarket — average credit score on applications, eviction rate, late-payment / NSF rate, and stable-employment percentage? A property-management company in the area should have these aggregated.
- How much new for-sale + rental construction is in the pipeline within 1–3 miles? Heavy new supply typically softens prices + rents 12–24 months out; constrained supply supports both.
CashFlowRE · CFR-B71KKMAN7TGDK4
· Data 3 weeks ago
cashflowre.app · 2026-05-29