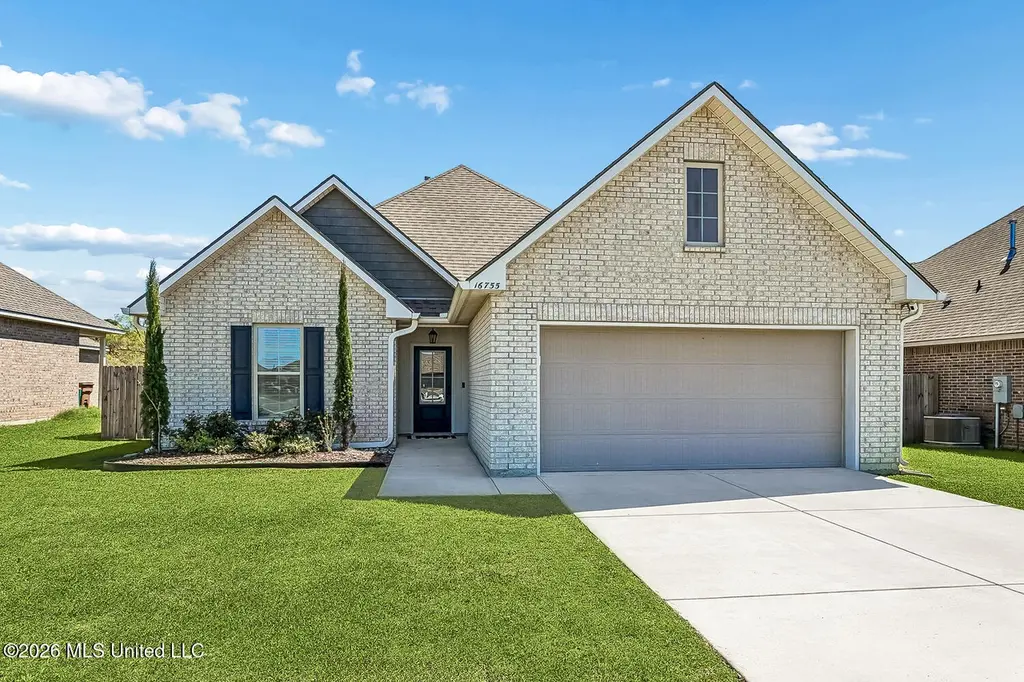
16755 Desmare St
Lyman, MS 39503
$255,000C-
3 bd · 1.0 ba ·
1,712 sqft ·
Built 2020
· SingleFamily
· Pending
· 26 DOM
Cashflow @ list (25.0% down · 7.5%)
Estimated rent
$2,094/mo
Mortgage (P&I)
−$1,337
Tax + insurance
−$335
HOA
−$17
Vac / Maint / Mgmt
−$440
Net cashflow
$-34/mo
Annual
$-410/yr
Cap rate
6.13%
Cash-on-cash
-0.57%
DSCR
0.97
1% rule
0.82%
Cash to close
$71,400
Investor read
- This is a 3-bed/1.0-bath single-family listed at $255k. Condition is rated good.
- At list price, monthly cash flow is $-34 ($-410/yr) — negative.
- To cash-flow at today's rent, offer at most $249k (2.4% below list).
- To meet the 1% rule (rent ≥ 1% of price), the offer needs to be $209k (17.9% below list).
- It's been on market 26 days — a 2% lower offer ($251k) is reasonable based on typical stale-listing flexibility.
- Recommended offer: $209k (17.9% below list) — sets the bar for 1% rule.
- Local home prices are declining (-3.0%/yr); year-one equity from $2k of loan paydown is wiped out by about $8k of value loss. Plan a longer hold.
- Location reads 69/100 on livability (#47 in MS) — a middle-class / working-renter tenant base. Strengths: crime A+, employment A+, cost of living A+; Watch: schools F, amenities F, commute F.
- Harrison County School District (rural): math 52% / reading 46% proficiency, ranked #14 of 130 in MS (top 11%) — families likely to look elsewhere, expect single-tenant / working-renter base with shorter leases; 62% free/reduced lunch — lower-income household profile, screen leases tightly.
- Market conditions: Rents rising fast (+7.0%/yr); 770 active listings in the ZIP; 2 comparable units currently listed for rent nearby; 2,194 units permitted in Harrison County in 2024 (0 in 5+ unit buildings).
- Harrison County population projected at +27% by 2050 — long-run rental-demand tailwind backs the buy-and-hold thesis.
- 3 sale attempts since 6y ago with the ask held roughly flat each time — persistent listings suggest the price (not the market) is what's stuck; bring a comps-based counter.
- Climate carrying-cost: severe wind risk, 99% chance of damaging wind over 30y; moderate wildfire risk; extreme-heat days projected 7→21/yr by 2055 (HVAC capex compounding) — expect insurance premiums to compound above CPI over the hold.
- Cap rate 6.1% vs local median 4.4% in Lyman — top-decile yield for the area; either an underpriced asset or a hidden risk that comps aren't pricing in. Stress-test before assuming the spread holds.
- This rent runs 40% of the median local income ($63k/yr) — at the standard rent-burdened threshold; future hikes will face affordability resistance.
Questions for listing agent
- What do current leases actually rent for vs. the listed asking? Can we see a recent rent roll and the last 12 months of T-12 income?
- What does the HOA fee cover, when was the last increase, and are there any pending special assessments or reserve-fund shortfalls?
- Is there a deadline driving the sale (1031 exchange, divorce, estate, relocation)? That informs how much negotiation room exists.
- Schools are F-rated, which usually means shorter tenancies and higher turnover. Who's the typical renter profile here, and what's been the actual vacancy rate?
- This sits on a lake — are riparian / water-frontage rights deeded with the parcel? Any dock permits, shoreline easements, or HOA water-use restrictions?
- What's the documented flood / surge / shoreline-erosion history here (FEMA AND non-FEMA — e.g., storm surge, creek backup, septic-field saturation)?
- Any water-quality or seasonal algae-bloom issues that affect tenant satisfaction or short-term-rental demand?
- What's the average days-on-market for RENTAL listings here right now (not sales)? A rising rental-DOM trend means longer vacancies and softer asking-rent achievability than the comps imply.
CashFlowRE · CFR-BAR320DFPW1TST
· Data 4 weeks ago
cashflowre.app · 2026-05-29