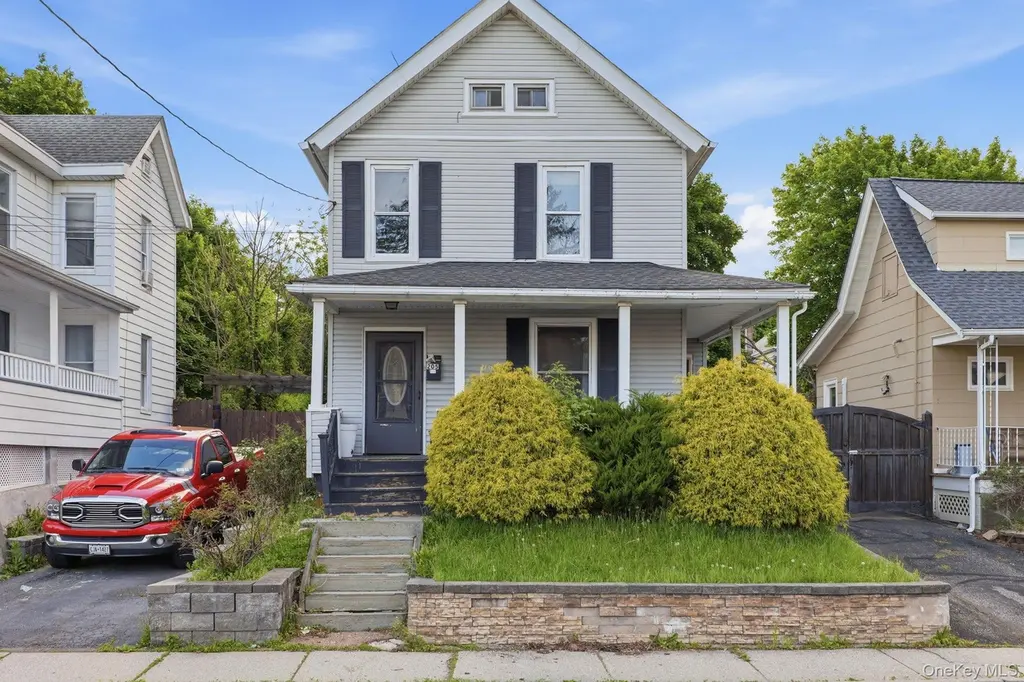
205 Linden Ave
Middletown, NY 10940
$310,000D
3 bd · 2.0 ba ·
1,061 sqft ·
Built 1900
· SingleFamily
· Pending
· 23 DOM
Cashflow @ list (25.0% down · 7.5%)
Estimated rent
$2,537/mo
Mortgage (P&I)
−$1,626
Tax + insurance
−$568
HOA
−$0
Vac / Maint / Mgmt
−$533
Net cashflow
$-189/mo
Annual
$-2,271/yr
Cap rate
5.56%
Cash-on-cash
-2.62%
DSCR
0.88
1% rule
0.82%
Cash to close
$86,800
Investor read
- This is a 3-bed/2.0-bath single-family listed at $310k.
- At list price, monthly cash flow is $-189 ($-2k/yr) — negative.
- To cash-flow at today's rent, offer at most $277k (10.8% below list).
- To meet the 1% rule (rent ≥ 1% of price), the offer needs to be $254k (18.2% below list).
- It's been on market 23 days — a 2% lower offer ($305k) is reasonable based on typical stale-listing flexibility.
- Recommended offer: $254k (18.2% below list) — sets the bar for 1% rule.
- Local home prices are declining (-3.0%/yr); year-one equity from $2k of loan paydown is wiped out by about $9k of value loss. Plan a longer hold.
- Location reads 82/100 on livability (#79 in NY, #1,219 nationally) — a professional / high-income tenant draw. Strengths: amenities A+, housing A+, health & safety A+; Watch: commute C-.
- Middletown City School District (suburban): math 41% / reading 55% proficiency, ranked #411 of 590 in NY (top 70%) — families likely to look elsewhere, expect single-tenant / working-renter base with shorter leases; 61% free/reduced lunch — lower-income household profile, screen leases tightly.
- Zoned schools: Presidential Park Elementary School (math 19% / reading 37%, grade F, #1,774 of 2,108 statewide, top 84%, 1,300 students, 76% FRL); Middletown Twin Towers Middle School (math 10% / reading 42%, grade F, #595 of 729 statewide, top 82%, 858 students, 78% FRL); Middletown High School (math 90% / reading 92%, grade A+, #203 of 1,100 statewide, top 20%, 2,523 students, 71% FRL).
- Watch-outs: built in 1900 — expect roof / HVAC / electrical / plumbing capex.
- Market conditions: Rents rising fast (+8.2%/yr); 283 active listings in the ZIP; 28 comparable units currently listed for rent nearby; rentals lingering (median 46d on market — plan ~5-8 weeks vacancy on turnover, expect pricing pressure); 50% of comp listings sitting > 30 days — soft ceiling on asking rent; solid renter incomes; 1,746 units permitted in Orange County in 2024 (1,265 in 5+ unit buildings).
- 3 sale attempts since 6y ago with the ask held roughly flat each time — persistent listings suggest the price (not the market) is what's stuck; bring a comps-based counter.
- Current owner paid $255k; 22% above their basis — modest negotiation headroom, anchor on the comps not their cost.
- Cap rate 5.6% vs local median 3.4% in Middletown — top-decile yield for the area; either an underpriced asset or a hidden risk that comps aren't pricing in. Stress-test before assuming the spread holds.
- This rent runs 35% of the median local income ($87k/yr) — at the standard rent-burdened threshold; future hikes will face affordability resistance.
Questions for listing agent
- What do current leases actually rent for vs. the listed asking? Can we see a recent rent roll and the last 12 months of T-12 income?
- Built in 1900 — when were the roof, HVAC, electrical panel, plumbing, and water heater last replaced?
- Is there a deadline driving the sale (1031 exchange, divorce, estate, relocation)? That informs how much negotiation room exists.
- Schools are D-rated, which usually means shorter tenancies and higher turnover. Who's the typical renter profile here, and what's been the actual vacancy rate?
- The area grade is low — what's the realistic commute time and amenity access for the typical tenant pool here? Any planned neighborhood developments (good or bad) we should know about?
- What's the average days-on-market for RENTAL listings here right now (not sales)? A rising rental-DOM trend means longer vacancies and softer asking-rent achievability than the comps imply.
- What's the recent tenant-quality profile in this submarket — average credit score on applications, eviction rate, late-payment / NSF rate, and stable-employment percentage? A property-management company in the area should have these aggregated.
- How much new for-sale + rental construction is in the pipeline within 1–3 miles? Heavy new supply typically softens prices + rents 12–24 months out; constrained supply supports both.
CashFlowRE · CFR-BBFB1K01EQHJH1
· Data 2 weeks ago
cashflowre.app · 2026-05-29