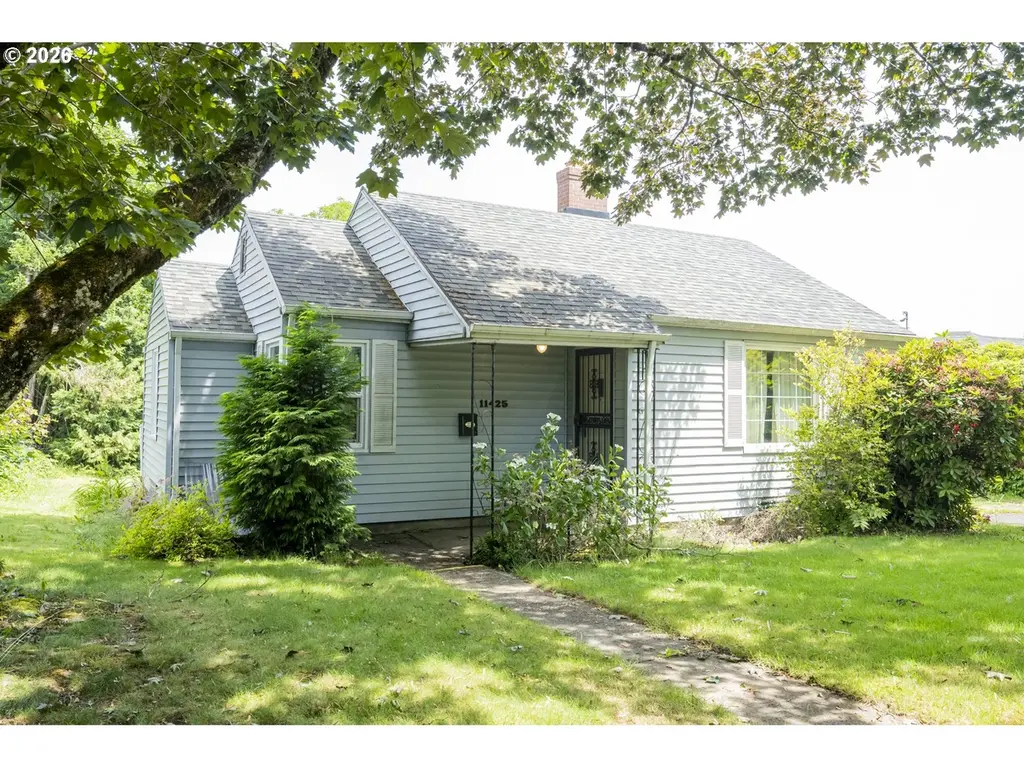
11425 NE Shaver St
Portland, OR 97220
$299,000F
2 bd · 1.0 ba ·
955 sqft ·
Built 1945
· SingleFamily
· Active
· 1 DOM
Cashflow @ list (25.0% down · 7.5%)
Estimated rent
$1,689/mo
Mortgage (P&I)
−$1,568
Tax + insurance
−$473
HOA
−$0
Vac / Maint / Mgmt
−$355
Net cashflow
$-707/mo
Annual
$-8,485/yr
Cap rate
3.46%
Cash-on-cash
-10.13%
DSCR
0.55
1% rule
0.56%
Cash to close
$83,720
Investor read
- This is a 2-bed/1.0-bath single-family listed at $299k.
- At list price, monthly cash flow is $-707 ($-8k/yr) — negative.
- To cash-flow at today's rent, offer at most $174k (41.8% below list).
- To meet the 1% rule (rent ≥ 1% of price), the offer needs to be $169k (43.5% below list).
- Only 1 days on market — expect competitive offers; lowballing is unlikely to land.
- Recommended offer: $169k (43.5% below list) — sets the bar for 1% rule.
- Local home prices are declining (-3.0%/yr); year-one equity from $2k of loan paydown is wiped out by about $9k of value loss. Plan a longer hold.
- Location reads 77/100 on livability (#72 in OR, #3,256 nationally) — a middle-class / working-renter tenant base. Strengths: amenities A+, commute A+, health & safety A+; Watch: crime F, cost of living F.
- Parkrose SD 3 (urban): math 27% / reading 46% proficiency, ranked #128 of 183 in OR (top 70%) — families likely to look elsewhere, expect single-tenant / working-renter base with shorter leases; 65% free/reduced lunch — lower-income household profile, screen leases tightly.
- Zoned schools: Prescott Elementary School (266 students, 83% FRL); Parkrose Middle School (669 students, 71% FRL); Parkrose High School (998 students, 72% FRL).
- Watch-outs: built in 1945 — expect roof / HVAC / electrical / plumbing capex.
- Market conditions: Rents flat; 130 active listings in the ZIP; 40 comparable units currently listed for rent nearby; rentals at typical pace (median 17d on market — plan ~3-4 weeks tenant-placement turnaround); 2,041 units permitted in Multnomah County in 2024 (905 in 5+ unit buildings).
- Multnomah County population projected at +33% by 2050 — long-run rental-demand tailwind backs the buy-and-hold thesis.
- Cap rate 3.5% vs local median 2.2% in Portland — top-decile yield for the area; either an underpriced asset or a hidden risk that comps aren't pricing in. Stress-test before assuming the spread holds.
Questions for listing agent
- What do current leases actually rent for vs. the listed asking? Can we see a recent rent roll and the last 12 months of T-12 income?
- Built in 1945 — when were the roof, HVAC, electrical panel, plumbing, and water heater last replaced?
- Is there a deadline driving the sale (1031 exchange, divorce, estate, relocation)? That informs how much negotiation room exists.
- Crime grade is F in this area — have there been break-ins, vandalism, or insurance claims at this property in the last 3 years? What carrier currently insures it and at what premium?
- The area grade is low — what's the realistic commute time and amenity access for the typical tenant pool here? Any planned neighborhood developments (good or bad) we should know about?
- What's the average days-on-market for RENTAL listings here right now (not sales)? A rising rental-DOM trend means longer vacancies and softer asking-rent achievability than the comps imply.
- What's the recent tenant-quality profile in this submarket — average credit score on applications, eviction rate, late-payment / NSF rate, and stable-employment percentage? A property-management company in the area should have these aggregated.
- How much new for-sale + rental construction is in the pipeline within 1–3 miles? Heavy new supply typically softens prices + rents 12–24 months out; constrained supply supports both.
CashFlowRE · CFR-BCXJF0F06VEW4X
· Data 2 days ago
cashflowre.app · 2026-05-29