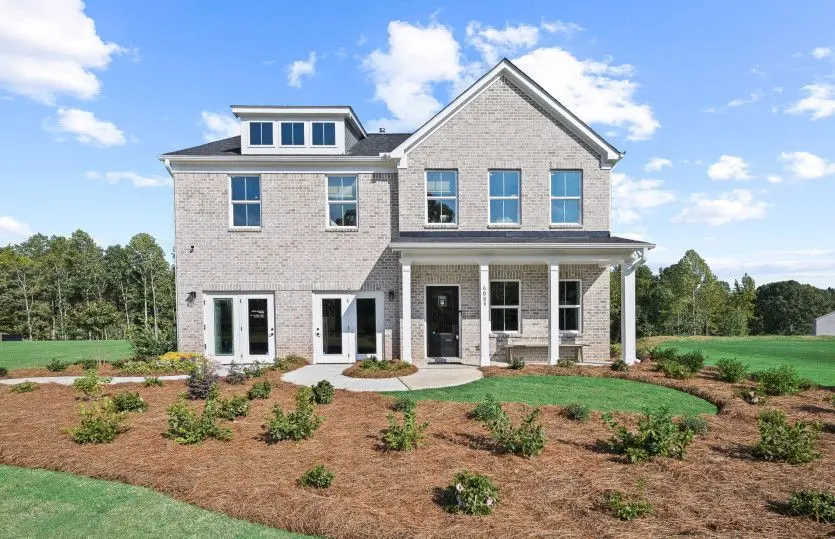
Hampton Plan
South Fulton, GA 30349
$399,990F
4 bd · 2.5 ba ·
2,622 sqft ·
Built —
· SingleFamily
· Active
· 281 DOM
Cashflow @ list (25.0% down · 7.5%)
Estimated rent
$2,539/mo
Mortgage (P&I)
−$2,597
Tax + insurance
−$826
HOA
−$0
Vac / Maint / Mgmt
−$533
Net cashflow
$-1,417/mo
Annual
$-17,003/yr
Cap rate
2.86%
Cash-on-cash
-12.26%
DSCR
0.45
1% rule
0.51%
Cash to close
$138,685
Investor read
- This is a 4-bed/2.5-bath single-family listed at $400k.
- At list price, monthly cash flow is $-1k ($-17k/yr) — negative.
- To cash-flow at today's rent, offer at most $290k (27.4% below list).
- To meet the 1% rule (rent ≥ 1% of price), the offer needs to be $254k (36.5% below list).
- It's been on market 281 days — a 12% lower offer ($352k) is reasonable based on typical stale-listing flexibility.
- Recommended offer: $254k (36.5% below list) — sets the bar for 1% rule.
- In year one you build about $53k of equity ($3k loan paydown + $50k appreciation (10.0% local appreciation)).
- Location reads: area grade F — affects rentability + tenant quality, not the cash-flow math above.
- Fulton County (suburban): math 49% / reading 53% proficiency, ranked #12 of 174 in GA (top 7%) — acceptable for families but not a draw, mixed tenant base, ~2y average lease.
- Market conditions: Rents flat; 651 active listings in the ZIP; 11 comparable units currently listed for rent nearby; rentals at typical pace (median 19d on market — plan ~3-4 weeks tenant-placement turnaround); 11,565 units permitted in Fulton County in 2024 (8,159 in 5+ unit buildings).
- Fulton County population projected at +38% by 2050 — long-run rental-demand tailwind backs the buy-and-hold thesis.
- By year 2, paydown + projected appreciation supports a ~$85k cash-out refi (75% LTV) — recoverable capital for the next deal without selling this one.
- Cap rate 2.9% vs local median 4.6% in South Fulton — below-typical yield; the buyer is paying a premium for something (appreciation thesis, condition, location) that the cap rate doesn't capture.
- At $2,539/mo this rent would consume 45% of the median local household income ($67k/yr) (locally 4258% of renters already pay >50% of income on rent) — very limited rent-growth headroom before tenants either downsize or default.
Questions for listing agent
- What do current leases actually rent for vs. the listed asking? Can we see a recent rent roll and the last 12 months of T-12 income?
- It's been on market 281 days. Have you received any prior offers? Is the seller open to a 37% concession, seller financing, or rate buy-down credit?
- Why hasn't it sold? Are there any deal-killer items the seller is aware of (foundation, flood, title, zoning, code violations)?
- Is there a deadline driving the sale (1031 exchange, divorce, estate, relocation)? That informs how much negotiation room exists.
- The area grade is low — what's the realistic commute time and amenity access for the typical tenant pool here? Any planned neighborhood developments (good or bad) we should know about?
- What's the average days-on-market for RENTAL listings here right now (not sales)? A rising rental-DOM trend means longer vacancies and softer asking-rent achievability than the comps imply.
- What's the recent tenant-quality profile in this submarket — average credit score on applications, eviction rate, late-payment / NSF rate, and stable-employment percentage? A property-management company in the area should have these aggregated.
- How much new for-sale + rental construction is in the pipeline within 1–3 miles? Heavy new supply typically softens prices + rents 12–24 months out; constrained supply supports both.
CashFlowRE · CFR-BG45YN159JT5MM
· Data 2 days ago
cashflowre.app · 2026-05-29