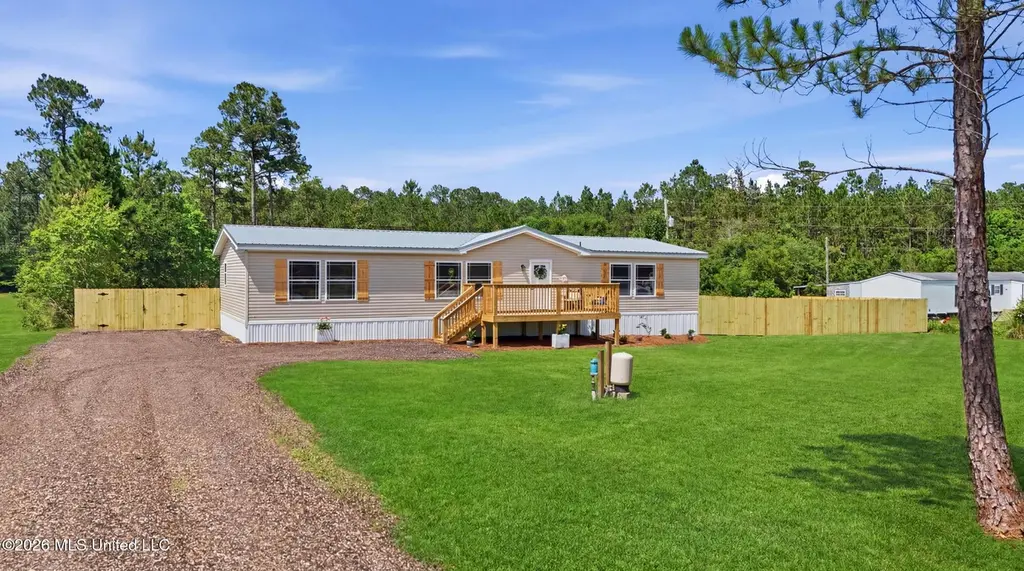
11604 Fox Ridge Dr
Latimer, MS 39565
$212,500F
3 bd · 2.0 ba ·
1,980 sqft ·
Built 2006
· Manufactured
· Pending
· 4 DOM
Cashflow @ list (25.0% down · 7.5%)
Estimated rent
$1,309/mo
Mortgage (P&I)
−$1,114
Tax + insurance
−$143
HOA
−$0
Vac / Maint / Mgmt
−$275
Net cashflow
$-224/mo
Annual
$-2,685/yr
Cap rate
5.03%
Cash-on-cash
-4.51%
DSCR
0.80
1% rule
0.62%
Cash to close
$59,500
Investor read
- This is a 3-bed/2.0-bath manufactured listed at $212k.
- At list price, monthly cash flow is $-224 ($-3k/yr) — negative.
- To cash-flow at today's rent, offer at most $173k (18.6% below list).
- To meet the 1% rule (rent ≥ 1% of price), the offer needs to be $131k (38.4% below list).
- Only 4 days on market — expect competitive offers; lowballing is unlikely to land.
- Recommended offer: $131k (38.4% below list) — sets the bar for 1% rule.
- Local home prices are declining (-3.0%/yr); year-one equity from $1k of loan paydown is wiped out by about $6k of value loss. Plan a longer hold.
- Location reads 65/100 on livability (#120 in MS) — a middle-class / working-renter tenant base. Strengths: crime A+, cost of living A+, housing A+; Watch: amenities F, commute F, health & safety F.
- Jackson County School District (rural): math 53% / reading 48% proficiency, ranked #10 of 130 in MS (top 8%) — acceptable for families but not a draw, mixed tenant base, ~2y average lease.
- Zoned schools: St Martin East Elementary School (math 67% / reading 57%, grade B, #18 of 375 statewide, top 5%, 685 students, 100% FRL); St. Martin Middle School (math 44% / reading 39%, grade F, #53 of 179 statewide, top 30%, 995 students, 100% FRL); St Martin High School (math 65% / reading 49%, grade C, #8 of 197 statewide, top 4%, 1,283 students, 100% FRL) — zoned schools average 100% FRL vs 50% district-wide (50 pts higher); higher-poverty schools than district average — tighter screening recommended.
- Market conditions: 195 active listings in the ZIP; 516 units permitted in Jackson County in 2024 (6 in 5+ unit buildings).
- Climate carrying-cost: severe wind risk, 99% chance of damaging wind over 30y; major wildfire risk; extreme-heat days projected 7→22/yr by 2055 (HVAC capex compounding) — expect insurance premiums to compound above CPI over the hold.
- Cap rate 5.0% vs local median 3.5% in Latimer — top-decile yield for the area; either an underpriced asset or a hidden risk that comps aren't pricing in. Stress-test before assuming the spread holds.
Questions for listing agent
- What do current leases actually rent for vs. the listed asking? Can we see a recent rent roll and the last 12 months of T-12 income?
- Is there a deadline driving the sale (1031 exchange, divorce, estate, relocation)? That informs how much negotiation room exists.
- Schools are F-rated, which usually means shorter tenancies and higher turnover. Who's the typical renter profile here, and what's been the actual vacancy rate?
- The area grade is low — what's the realistic commute time and amenity access for the typical tenant pool here? Any planned neighborhood developments (good or bad) we should know about?
- What's the average days-on-market for RENTAL listings here right now (not sales)? A rising rental-DOM trend means longer vacancies and softer asking-rent achievability than the comps imply.
- What's the recent tenant-quality profile in this submarket — average credit score on applications, eviction rate, late-payment / NSF rate, and stable-employment percentage? A property-management company in the area should have these aggregated.
- How much new for-sale + rental construction is in the pipeline within 1–3 miles? Heavy new supply typically softens prices + rents 12–24 months out; constrained supply supports both.
CashFlowRE · CFR-BG8653FEEFA148
· Data 4 weeks ago
cashflowre.app · 2026-05-29