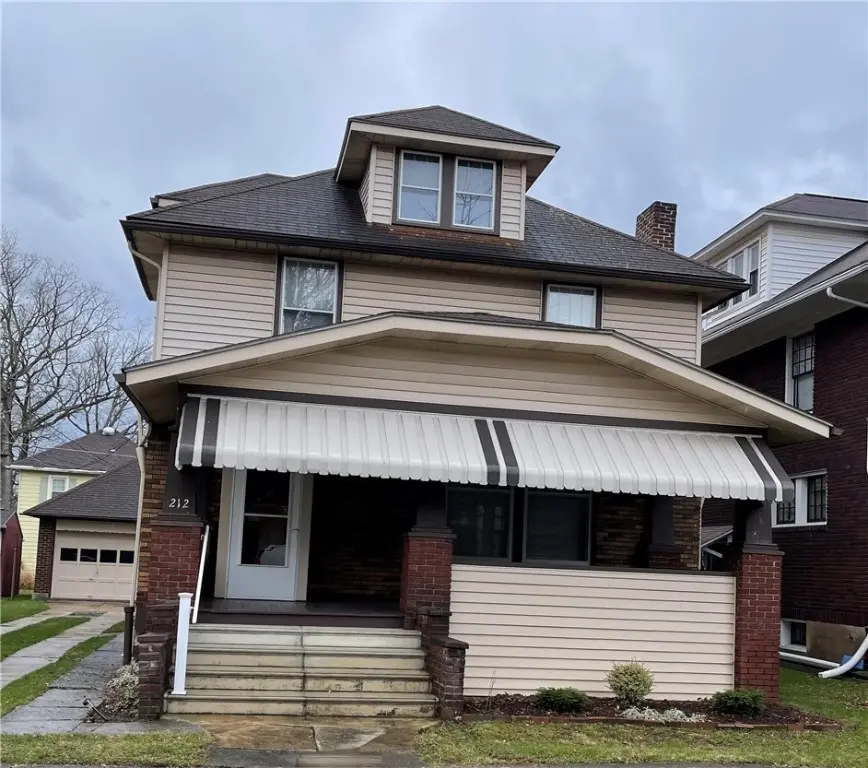
212 Worth St
Johnstown, PA 15905
$99,500B-
4 bd · 1.0 ba ·
141,411 sqft ·
Built —
· SingleFamily
· Pending
Cashflow @ list (25.0% down · 7.5%)
Estimated rent
$1,519/mo
Mortgage (P&I)
−$522
Tax + insurance
−$202
HOA
−$0
Vac / Maint / Mgmt
−$319
Net cashflow
$477/mo
Annual
$5,723/yr
Cap rate
12.04%
Cash-on-cash
20.54%
DSCR
1.91
1% rule
1.53%
Cash to close
$27,860
Investor read
- This is a 4-bed/1.0-bath single-family listed at $100k.
- At list price, monthly cash flow is $477 ($6k/yr) — positive.
- The deal already cash-flows at list — no discount required.
- Meets the 1% rule at list price ($2k rent vs $100k).
- Only 0 days on market — expect competitive offers; lowballing is unlikely to land.
- Local home prices are declining (-3.0%/yr); year-one equity from $688 of loan paydown is wiped out by about $3k of value loss. Plan a longer hold.
- Location reads 77/100 on livability (#363 in PA, #3,168 nationally) — a middle-class / working-renter tenant base. Strengths: amenities A+, commute A+, cost of living A+; Watch: crime F, employment F.
- Greater Johnstown SD (urban): math 9% / reading 25% proficiency, ranked #509 of 539 in PA (top 94%) — low school quality limits family demand, transient renter base, plan for 1-2y turnover; 80% free/reduced lunch — lower-income household profile, screen leases tightly.
- Zoned schools: Greater Johnstown El Sch (math 14% / reading 21%, grade F, #1,291 of 1,518 statewide, top 85%, 1,269 students, 100% FRL); Greater Johnstown Ms (math 6% / reading 24%, grade F, #471 of 512 statewide, top 93%, 660 students, 100% FRL); Greater Johnstown Shs (math 8% / reading 32%, grade F, #387 of 437 statewide, top 89%, 894 students, 98% FRL) — zoned schools average 100% FRL vs 80% district-wide (20 pts higher); higher-poverty schools than district average — tighter screening recommended.
- Market conditions: 94 active listings in the ZIP; 64 units permitted in Cambria County in 2024 (0 in 5+ unit buildings).
- Cambria County population projected at -28% by 2050 — secular population decline; favor cash flow + early exit over multi-decade hold.
- 2 sale attempts since 4y ago with the ask held roughly flat each time — persistent listings suggest the price (not the market) is what's stuck; bring a comps-based counter.
- Current owner paid $85k; 17% above their basis — modest negotiation headroom, anchor on the comps not their cost.
- At projected returns (-3.0% appreciation + 3.0% rent growth), your $28k cash investment doubles in ~6 years — after that, you're playing with house money.
- Cap rate 12.0% vs local median 15.2% in Johnstown — below-typical yield; the buyer is paying a premium for something (appreciation thesis, condition, location) that the cap rate doesn't capture.
Questions for listing agent
- Is there a deadline driving the sale (1031 exchange, divorce, estate, relocation)? That informs how much negotiation room exists.
- Schools are D-rated, which usually means shorter tenancies and higher turnover. Who's the typical renter profile here, and what's been the actual vacancy rate?
- Crime grade is F in this area — have there been break-ins, vandalism, or insurance claims at this property in the last 3 years? What carrier currently insures it and at what premium?
- What's the average days-on-market for RENTAL listings here right now (not sales)? A rising rental-DOM trend means longer vacancies and softer asking-rent achievability than the comps imply.
- What's the recent tenant-quality profile in this submarket — average credit score on applications, eviction rate, late-payment / NSF rate, and stable-employment percentage? A property-management company in the area should have these aggregated.
- How much new for-sale + rental construction is in the pipeline within 1–3 miles? Heavy new supply typically softens prices + rents 12–24 months out; constrained supply supports both.
CashFlowRE · CFR-BG9Q278ZH6912S
· Data 4 weeks ago
cashflowre.app · 2026-05-29