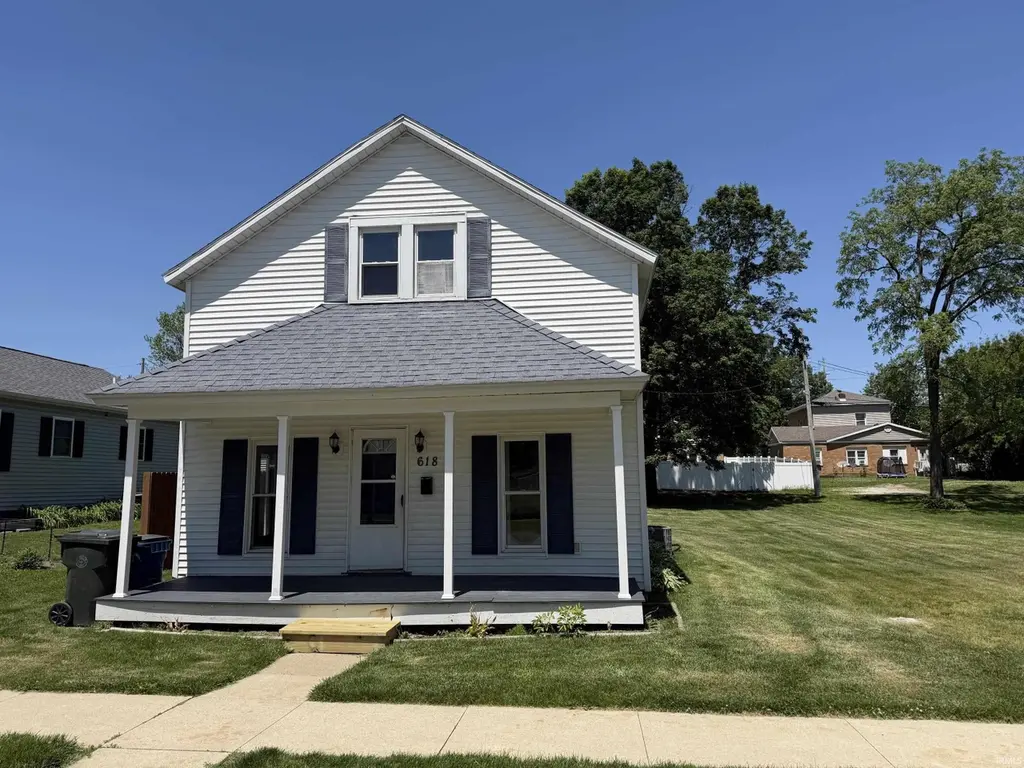
618 W Washington St
Plymouth, IN 46563
$179,900C-
3 bd · 2.0 ba ·
1,264 sqft ·
Built 1900
· SingleFamily
· Active
· 22 DOM
Cashflow @ list (25.0% down · 7.5%)
Estimated rent
$1,811/mo
Mortgage (P&I)
−$943
Tax + insurance
−$210
HOA
−$0
Vac / Maint / Mgmt
−$380
Net cashflow
$277/mo
Annual
$3,328/yr
Cap rate
8.14%
Cash-on-cash
6.61%
DSCR
1.29
1% rule
1.01%
Cash to close
$50,372
Investor read
- This is a 3-bed/2.0-bath single-family listed at $180k.
- At list price, monthly cash flow is $277 ($3k/yr) — positive.
- The deal already cash-flows at list — no discount required.
- Meets the 1% rule at list price ($2k rent vs $180k).
- It's been on market 22 days — a 2% lower offer ($177k) is reasonable based on typical stale-listing flexibility.
- Recommended offer: $177k (1.5% below list) — sets the bar for market timing.
- Local home prices are declining (-3.0%/yr); year-one equity from $1k of loan paydown is wiped out by about $5k of value loss. Plan a longer hold.
- Location reads 71/100 on livability (#142 in IN) — a middle-class / working-renter tenant base. Strengths: cost of living A+, housing A+, health & safety A+; Watch: crime C-, amenities F, commute F.
- Plymouth Community School Corporation (town): math 33% / reading 41% proficiency, ranked #173 of 301 in IN (top 58%) — families likely to look elsewhere, expect single-tenant / working-renter base with shorter leases.
- Zoned schools: Washington Discovery Academy (math 37% / reading 32%, grade F, #597 of 994 statewide, top 63%, 225 students, 65% FRL); Lincoln Junior High School (math 30% / reading 46%, grade F, #136 of 330 statewide, top 44%, 510 students, 56% FRL); Plymouth High School (math 37% / reading 60%, grade D, #139 of 369 statewide, top 38%, 1,078 students, 51% FRL).
- Watch-outs: built in 1900 — expect roof / HVAC / electrical / plumbing capex.
- Market conditions: 82 active listings in the ZIP; 3 comparable units currently listed for rent nearby; rentals lingering (median 44d on market — plan ~5-8 weeks vacancy on turnover, expect pricing pressure); 67% of comp listings sitting > 30 days — soft ceiling on asking rent; 147 units permitted in Marshall County in 2024 (0 in 5+ unit buildings).
- Marshall County population projected to shrink 9% by 2050 — rents likely to lag national; underwrite the cash flow, not the appreciation.
- Cap rate 8.1% vs local median 3.5% in Plymouth — top-decile yield for the area; either an underpriced asset or a hidden risk that comps aren't pricing in. Stress-test before assuming the spread holds.
Questions for listing agent
- Built in 1900 — when were the roof, HVAC, electrical panel, plumbing, and water heater last replaced?
- Is there a deadline driving the sale (1031 exchange, divorce, estate, relocation)? That informs how much negotiation room exists.
- Schools are D-rated, which usually means shorter tenancies and higher turnover. Who's the typical renter profile here, and what's been the actual vacancy rate?
- What's the average days-on-market for RENTAL listings here right now (not sales)? A rising rental-DOM trend means longer vacancies and softer asking-rent achievability than the comps imply.
- What's the recent tenant-quality profile in this submarket — average credit score on applications, eviction rate, late-payment / NSF rate, and stable-employment percentage? A property-management company in the area should have these aggregated.
- How much new for-sale + rental construction is in the pipeline within 1–3 miles? Heavy new supply typically softens prices + rents 12–24 months out; constrained supply supports both.
CashFlowRE · CFR-BK53F6ESSY4YFK
· Data 1 day ago
cashflowre.app · 2026-05-29