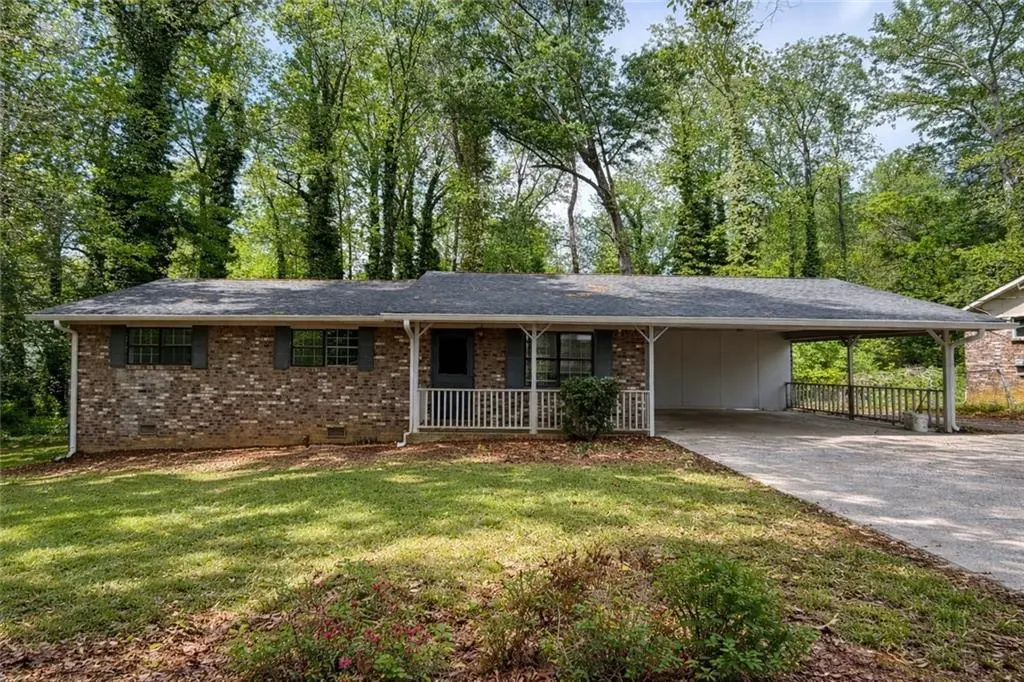
3354 Forest Hill Rd
Powder Springs, GA 30127
$225,000C-
3 bd · 1.5 ba ·
1,536 sqft ·
Built 1971
· SingleFamily
· Pending
· 28 DOM
Cashflow @ list (25.0% down · 7.5%)
Estimated rent
$2,171/mo
Mortgage (P&I)
−$1,180
Tax + insurance
−$805
HOA
−$0
Vac / Maint / Mgmt
−$456
Net cashflow
$-270/mo
Annual
$-3,240/yr
Cap rate
7.13%
Cash-on-cash
2.98%
DSCR
1.13
1% rule
0.96%
Cash to close
$63,000
Investor read
- This is a 3-bed/1.5-bath single-family listed at $225k.
- At list price, monthly cash flow is $-270 ($-3k/yr) — negative.
- To cash-flow at today's rent, offer at most $177k (21.2% below list).
- To meet the 1% rule (rent ≥ 1% of price), the offer needs to be $217k (3.5% below list).
- It's been on market 28 days — a 2% lower offer ($222k) is reasonable based on typical stale-listing flexibility.
- Recommended offer: $177k (21.2% below list) — sets the bar for cash-flow.
- Local home prices are declining (-3.0%/yr); year-one equity from $2k of loan paydown is wiped out by about $7k of value loss. Plan a longer hold.
- Location reads 71/100 on livability (#79 in GA) — a middle-class / working-renter tenant base. Strengths: housing A+, cost of living A, employment B+; Watch: amenities F, commute F.
- Cobb County (suburban): math 39% / reading 45% proficiency, ranked #25 of 174 in GA (top 14%) — families likely to look elsewhere, expect single-tenant / working-renter base with shorter leases.
- Watch-outs: flood insurance adds $427/mo.
- Market conditions: Rents flat; 650 active listings in the ZIP; 21 comparable units currently listed for rent nearby; rentals lingering (median 44d on market — plan ~5-8 weeks vacancy on turnover, expect pricing pressure); 67% of comp listings sitting > 30 days — soft ceiling on asking rent; high-income renter base; 1,625 units permitted in Cobb County in 2024 (389 in 5+ unit buildings).
- Cobb County population projected at +33% by 2050 — long-run rental-demand tailwind backs the buy-and-hold thesis.
- 4 sale attempts since 10y ago; this cycle's ask has dropped $64k (22%) from the opening price — seller is motivated, your offer sets the floor, not the list.
- Current owner paid $102k; list at $225k implies a 121% gain — meaningful room to come down on a strong offer.
- Climate carrying-cost: in FEMA flood zone AE (mandatory federal flood insurance); moderate wind risk, 25% chance of damaging wind over 30y; extreme-heat days projected 7→17/yr by 2055 (HVAC capex compounding) — expect insurance premiums to compound above CPI over the hold.
- Cap rate 7.1% vs local median 3.7% in Powder Springs — top-decile yield for the area; either an underpriced asset or a hidden risk that comps aren't pricing in. Stress-test before assuming the spread holds.
Questions for listing agent
- What do current leases actually rent for vs. the listed asking? Can we see a recent rent roll and the last 12 months of T-12 income?
- Built in 1971 — when were the roof, HVAC, electrical panel, plumbing, and water heater last replaced?
- What's the actual annual flood-insurance premium (NFIP or private), and is the property in a SFHA with mandatory coverage?
- Is there a deadline driving the sale (1031 exchange, divorce, estate, relocation)? That informs how much negotiation room exists.
- What's the average days-on-market for RENTAL listings here right now (not sales)? A rising rental-DOM trend means longer vacancies and softer asking-rent achievability than the comps imply.
- What's the recent tenant-quality profile in this submarket — average credit score on applications, eviction rate, late-payment / NSF rate, and stable-employment percentage? A property-management company in the area should have these aggregated.
- How much new for-sale + rental construction is in the pipeline within 1–3 miles? Heavy new supply typically softens prices + rents 12–24 months out; constrained supply supports both.
CashFlowRE · CFR-BKAW3E9WRWWANC
· Data 3 weeks ago
cashflowre.app · 2026-05-29