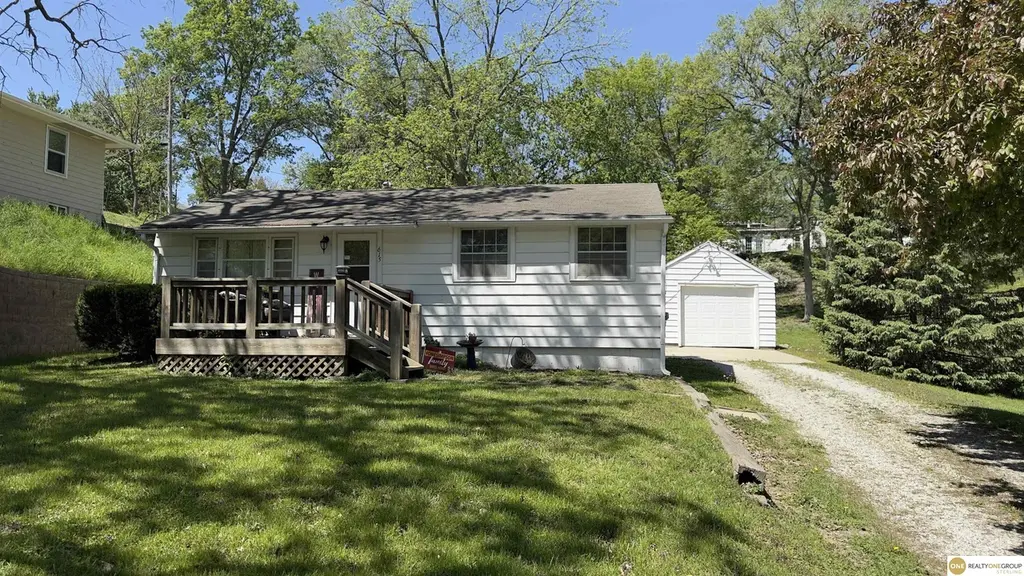
615 Main St
Louisville, NE 68037
$80,000B-
2 bd · 1.0 ba ·
1,260 sqft ·
Built 1937
· SingleFamily
· Pending
Cashflow @ list (25.0% down · 7.5%)
Estimated rent
$1,131/mo
Mortgage (P&I)
−$420
Tax + insurance
−$239
HOA
−$0
Vac / Maint / Mgmt
−$238
Net cashflow
$235/mo
Annual
$2,820/yr
Cap rate
9.82%
Cash-on-cash
12.59%
DSCR
1.56
1% rule
1.41%
Cash to close
$22,400
Investor read
- This is a 2-bed/1.0-bath single-family listed at $80k.
- At list price, monthly cash flow is $235 ($3k/yr) — positive.
- The deal already cash-flows at list — no discount required.
- Meets the 1% rule at list price ($1k rent vs $80k).
- Only 0 days on market — expect competitive offers; lowballing is unlikely to land.
- Local home prices are declining (-3.0%/yr); year-one equity from $553 of loan paydown is wiped out by about $2k of value loss. Plan a longer hold.
- Location reads 80/100 on livability (#27 in NE, #1,699 nationally) — a professional / high-income tenant draw. Strengths: crime A+, employment A+, cost of living A+; Watch: amenities F, commute F.
- Louisville Public Schools (rural): math 48% / reading 48% proficiency, ranked #65 of 111 in NE (top 59%) — families likely to look elsewhere, expect single-tenant / working-renter base with shorter leases; only 12% free/reduced lunch — higher-income household profile.
- Zoned schools: Louisville Elementary School (math 52% / reading 52%, grade C-, #200 of 502 statewide, top 46%, 399 students, 18% FRL); Louisville Middle School (math 42% / reading 42%, grade D-, #72 of 128 statewide, top 61%, 115 students, 9% FRL); Louisville High School (math 54% / reading 64%, grade C+, #49 of 261 statewide, top 26%, 188 students, 20% FRL) — zoned schools at 15% FRL track the district average.
- Watch-outs: property tax is 3.1% of price; built in 1937 — expect roof / HVAC / electrical / plumbing capex.
- Market conditions: 22 active listings in the ZIP; 86 units permitted in Cass County in 2024 (30 in 5+ unit buildings).
- Cass County population projected to shrink 3% by 2050 — rents likely to lag national; underwrite the cash flow, not the appreciation.
- 4 sale attempts since 16y ago with the ask held roughly flat each time — persistent listings suggest the price (not the market) is what's stuck; bring a comps-based counter.
- At projected returns (-3.0% appreciation + 3.0% rent growth), your $22k cash investment doubles in ~9 years — after that, you're playing with house money.
Questions for listing agent
- Built in 1937 — when were the roof, HVAC, electrical panel, plumbing, and water heater last replaced?
- Property tax is high relative to price — has the assessment been appealed recently, and will the sale trigger a re-assessment?
- Is there a deadline driving the sale (1031 exchange, divorce, estate, relocation)? That informs how much negotiation room exists.
- Schools are B-rated — typically a magnet for longer-tenancy family renters. What's the average tenant stay here, and is there a school-zone premium baked into asking?
- What's the average days-on-market for RENTAL listings here right now (not sales)? A rising rental-DOM trend means longer vacancies and softer asking-rent achievability than the comps imply.
- What's the recent tenant-quality profile in this submarket — average credit score on applications, eviction rate, late-payment / NSF rate, and stable-employment percentage? A property-management company in the area should have these aggregated.
- How much new for-sale + rental construction is in the pipeline within 1–3 miles? Heavy new supply typically softens prices + rents 12–24 months out; constrained supply supports both.
CashFlowRE · CFR-BKCB49FN1V7YQH
· Data 3 weeks ago
cashflowre.app · 2026-05-29