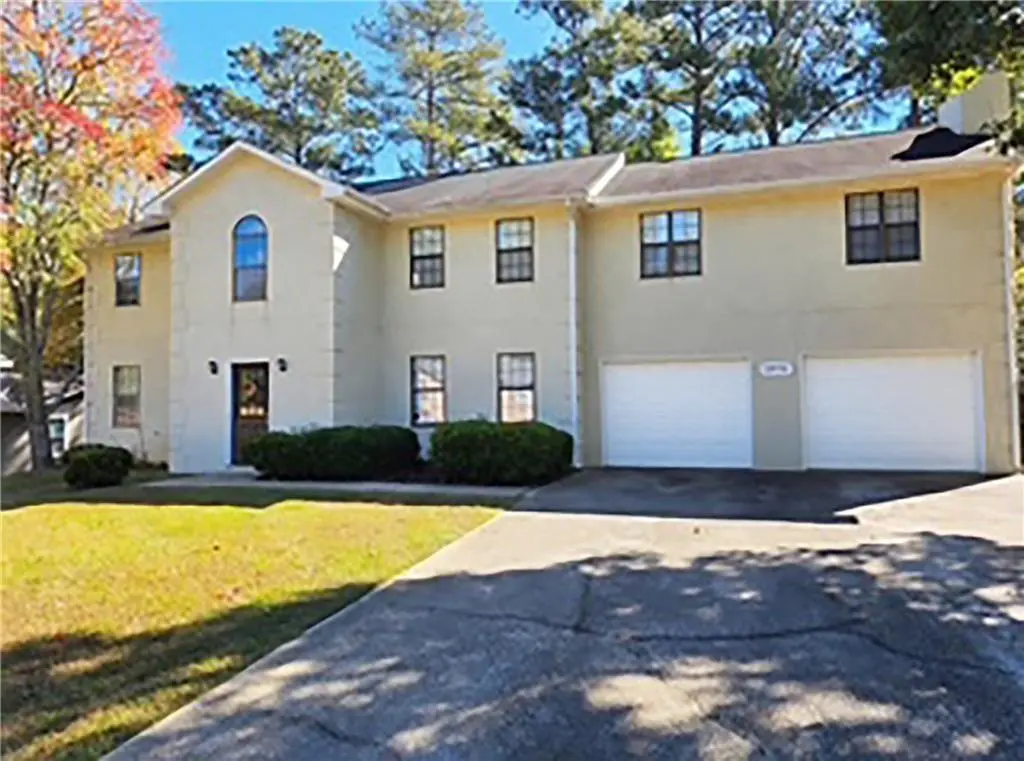
5956 N Castlegate Dr
South Fulton, GA 30349
$449,900C-
5 bd · 5.0 ba ·
3,328 sqft ·
Built 1988
· MultiFamily
· Pending
· 55 DOM
Cashflow @ list (25.0% down · 7.5%)
Estimated rent
$4,511/mo
Mortgage (P&I)
−$2,359
Tax + insurance
−$732
HOA
−$0
Vac / Maint / Mgmt
−$947
Net cashflow
$472/mo
Annual
$5,666/yr
Cap rate
7.55%
Cash-on-cash
4.50%
DSCR
1.20
1% rule
1.00%
Cash to close
$125,972
Investor read
- This is a 2×2bd/2.5ba + 1×1bd/1ba units multifamily listed at $450k.
- At list price, monthly cash flow is $472 ($6k/yr) — positive. Per door: $157/mo.
- The deal already cash-flows at list — no discount required.
- Meets the 1% rule at list price ($5k rent vs $450k).
- It's been on market 55 days — a 3% lower offer ($436k) is reasonable based on typical stale-listing flexibility.
- Recommended offer: $436k (3.0% below list) — sets the bar for market timing.
- In year one you build about $48k of equity ($3k loan paydown + $45k appreciation (10.0% local appreciation)).
- Location reads: area grade C — affects rentability + tenant quality, not the cash-flow math above.
- Clayton County (suburban): math 11% / reading 20% proficiency, ranked #155 of 174 in GA (top 89%) — low school quality limits family demand, transient renter base, plan for 1-2y turnover; 78% free/reduced lunch — lower-income household profile, screen leases tightly.
- Market conditions: Rents flat; 651 active listings in the ZIP; 5 comparable units currently listed for rent nearby; rentals leasing fast (median 6d on market — plan ~1-2 weeks tenant-placement turnaround); 865 units permitted in Clayton County in 2024 (448 in 5+ unit buildings).
- Clayton County population projected at +29% by 2050 — long-run rental-demand tailwind backs the buy-and-hold thesis.
- 13 sale attempts since 13y ago with the ask held roughly flat each time — persistent listings suggest the price (not the market) is what's stuck; bring a comps-based counter.
- At projected returns (10.0% appreciation + 0.9% rent growth), your $126k cash investment doubles in ~3 years — after that, you're playing with house money.
- By year 2, paydown + projected appreciation supports a ~$77k cash-out refi (75% LTV) — recoverable capital for the next deal without selling this one.
- Climate carrying-cost: major wind risk, 27% chance of damaging wind over 30y; extreme-heat days projected 7→18/yr by 2055 (HVAC capex compounding) — expect insurance premiums to compound above CPI over the hold.
- Cap rate 7.6% vs local median 4.6% in South Fulton — top-decile yield for the area; either an underpriced asset or a hidden risk that comps aren't pricing in. Stress-test before assuming the spread holds.
- At $4,511/mo this rent would consume 81% of the median local household income ($67k/yr) (locally 4258% of renters already pay >50% of income on rent) — very limited rent-growth headroom before tenants either downsize or default.
Questions for listing agent
- It's been on market 55 days. Have you received any prior offers? Is the seller open to a 3% concession, seller financing, or rate buy-down credit?
- Can we see the unit-by-unit rent roll, current vacancy, and any below-market leases? What's the average tenancy length?
- What capital expenditures (roof, boiler, parking lot, exteriors) have been made in the last 5 years, and what's planned in the next 2?
- Is there a deadline driving the sale (1031 exchange, divorce, estate, relocation)? That informs how much negotiation room exists.
- What's the average days-on-market for RENTAL listings here right now (not sales)? A rising rental-DOM trend means longer vacancies and softer asking-rent achievability than the comps imply.
- What's the recent tenant-quality profile in this submarket — average credit score on applications, eviction rate, late-payment / NSF rate, and stable-employment percentage? A property-management company in the area should have these aggregated.
- How much new apartment / multifamily construction is in the pipeline within 1–3 miles? Heavy new supply (>2% of stock underway) typically softens rents 12–24 months out; light construction supports rent growth.
CashFlowRE · CFR-BKQQ785WTZVC5G
· Data 2 weeks ago
cashflowre.app · 2026-05-29