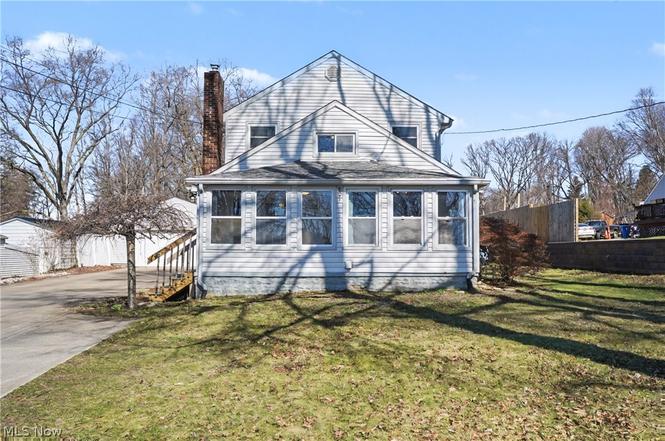
801 Chaffin Rd
Akron, OH 44306
$249,999B-
3 bd · 1.5 ba ·
1,848 sqft ·
Built 1943
· SingleFamily
· Pending
· 5 DOM
Cashflow @ list (25.0% down · 7.5%)
Estimated rent
$2,641/mo
Mortgage (P&I)
−$1,311
Tax + insurance
−$376
HOA
−$0
Vac / Maint / Mgmt
−$555
Net cashflow
$399/mo
Annual
$4,791/yr
Cap rate
8.21%
Cash-on-cash
6.84%
DSCR
1.30
1% rule
1.06%
Cash to close
$70,000
Investor read
- This is a 3-bed/1.5-bath single-family listed at $250k.
- At list price, monthly cash flow is $399 ($5k/yr) — positive.
- The deal already cash-flows at list — no discount required.
- Meets the 1% rule at list price ($3k rent vs $250k).
- Only 5 days on market — expect competitive offers; lowballing is unlikely to land.
- Local home prices are declining (-3.0%/yr); year-one equity from $2k of loan paydown is wiped out by about $8k of value loss. Plan a longer hold.
- Location reads 81/100 on livability (#104 in OH, #1,591 nationally) — a professional / high-income tenant draw. Strengths: amenities A+, commute A+, cost of living A+; Watch: crime F, employment F.
- Coventry Local (suburban): math 52% / reading 64% proficiency, ranked #315 of 656 in OH (top 48%) — acceptable for families but not a draw, mixed tenant base, ~2y average lease.
- Zoned schools: Coventry Elementary School (math 72% / reading 67%, grade A-, #391 of 1,584 statewide, top 27%, 461 students, 50% FRL); Coventry Middle School (math 49% / reading 66%, grade B, #302 of 654 statewide, top 46%, 479 students, 0% FRL); Coventry High School (math 37% / reading 52%, grade F, #470 of 781 statewide, top 62%, 557 students, 43% FRL).
- Watch-outs: built in 1943 — expect roof / HVAC / electrical / plumbing capex.
- Market conditions: Rents rising fast (+7.6%/yr); 71 active listings in the ZIP; 3 comparable units currently listed for rent nearby; rentals at typical pace (median 23d on market — plan ~3-4 weeks tenant-placement turnaround); lower-income renter base — watch delinquency; 1,114 units permitted in Summit County in 2024 (397 in 5+ unit buildings).
- Summit County population projected to shrink 6% by 2050 — rents likely to lag national; underwrite the cash flow, not the appreciation.
- At projected returns (-3.0% appreciation + 7.6% rent growth), your $70k cash investment doubles in ~9 years — after that, you're playing with house money.
- Cap rate 8.2% vs local median 6.6% in Akron — meaningfully above typical; check what's discounted (condition, days-on-market, listing class) to confirm the premium yield is real.
- At $2,641/mo this rent would consume 76% of the median local household income ($42k/yr) (locally 1251% of renters already pay >50% of income on rent) — very limited rent-growth headroom before tenants either downsize or default.
Questions for listing agent
- Built in 1943 — when were the roof, HVAC, electrical panel, plumbing, and water heater last replaced?
- Is there a deadline driving the sale (1031 exchange, divorce, estate, relocation)? That informs how much negotiation room exists.
- Crime grade is F in this area — have there been break-ins, vandalism, or insurance claims at this property in the last 3 years? What carrier currently insures it and at what premium?
- What's the average days-on-market for RENTAL listings here right now (not sales)? A rising rental-DOM trend means longer vacancies and softer asking-rent achievability than the comps imply.
- What's the recent tenant-quality profile in this submarket — average credit score on applications, eviction rate, late-payment / NSF rate, and stable-employment percentage? A property-management company in the area should have these aggregated.
- How much new for-sale + rental construction is in the pipeline within 1–3 miles? Heavy new supply typically softens prices + rents 12–24 months out; constrained supply supports both.
CashFlowRE · CFR-BN62H2BX9TZXKR
· Data 4 weeks ago
cashflowre.app · 2026-05-29