16206 SW Indianwood Cir
Indiantown, FL 34956
$99,900B+
2 bd · 2.0 ba ·
836 sqft ·
Built 2004
· Condo
· Active
· 14 DOM
Cashflow @ list (25.0% down · 7.5%)
Estimated rent
$1,834/mo
Mortgage (P&I)
−$524
Tax + insurance
−$195
HOA
−$0
Vac / Maint / Mgmt
−$385
Net cashflow
$730/mo
Annual
$8,765/yr
Cap rate
15.07%
Cash-on-cash
31.33%
DSCR
2.39
1% rule
1.84%
Cash to close
$27,972
Investor read
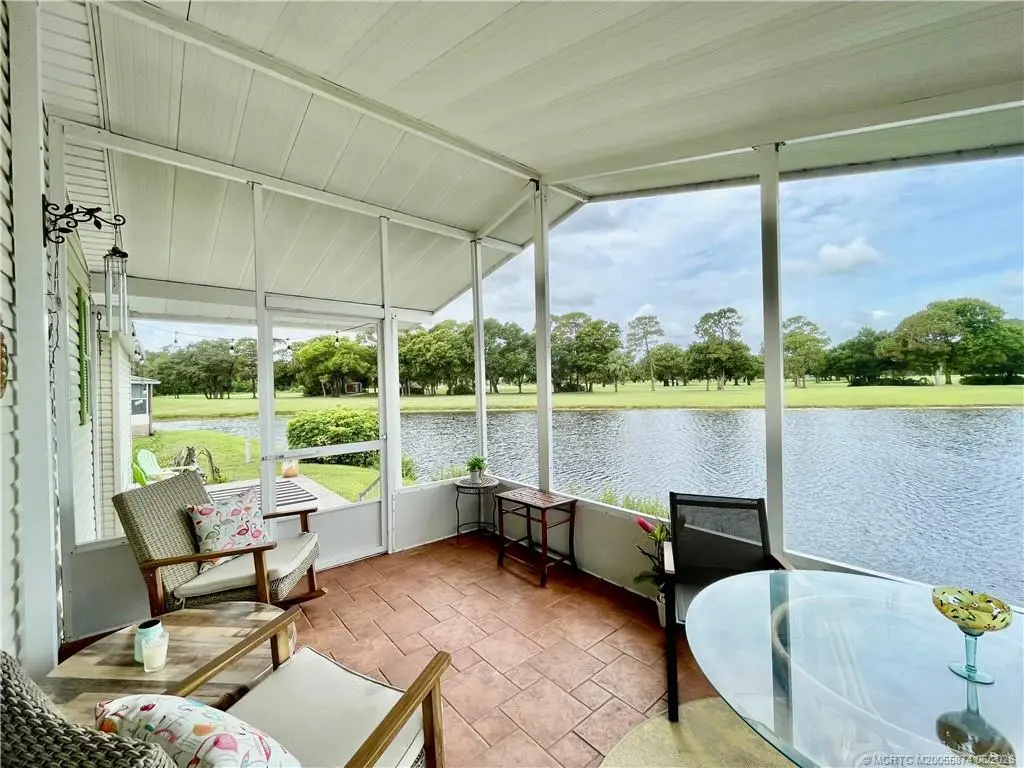
- This is a 2-bed/2.0-bath condo listed at $100k.
- At list price, monthly cash flow is $730 ($9k/yr) — positive.
- The deal already cash-flows at list — no discount required.
- Meets the 1% rule at list price ($2k rent vs $100k).
- Only 14 days on market — expect competitive offers; lowballing is unlikely to land.
- In year one you build about $7k of equity ($691 loan paydown + $7k appreciation (6.7% local appreciation)).
- Location reads 59/100 on livability (#829 in FL) — a working-class tenant base; expect higher turnover. Strengths: cost of living A+, housing A+; Watch: schools F, amenities F, commute F.
- Martin (suburban): math 52% / reading 53% proficiency, ranked #24 of 73 in FL (top 33%) — acceptable for families but not a draw, mixed tenant base, ~2y average lease.
- Market conditions: 135 active listings in the ZIP; 737 units permitted in Martin County in 2024 (167 in 5+ unit buildings).
- Martin County population projected at +19% by 2050 — long-run rental-demand tailwind backs the buy-and-hold thesis.
- 3 sale attempts since 2y ago with the ask held roughly flat each time — persistent listings suggest the price (not the market) is what's stuck; bring a comps-based counter.
- At projected returns (6.7% appreciation + 3.0% rent growth), your $28k cash investment doubles in ~2 years — after that, you're playing with house money.
- By year 5, paydown + projected appreciation supports a ~$32k cash-out refi (75% LTV) — recoverable capital for the next deal without selling this one.
- Climate carrying-cost: severe wind risk, 99% chance of damaging wind over 30y; moderate wildfire risk; extreme-heat days projected 7→24/yr by 2055 (HVAC capex compounding) — expect insurance premiums to compound above CPI over the hold.
- Cap rate 15.1% vs local median 10.9% in Indiantown — top-decile yield for the area; either an underpriced asset or a hidden risk that comps aren't pricing in. Stress-test before assuming the spread holds.
Questions for listing agent
- Any open or pending special assessments — roof, HVAC, plumbing, elevator, façade? What's the per-unit balance and payoff schedule, and is the seller paying it off at close or rolling it to the buyer?
- Is there a deadline driving the sale (1031 exchange, divorce, estate, relocation)? That informs how much negotiation room exists.
- Schools are F-rated, which usually means shorter tenancies and higher turnover. Who's the typical renter profile here, and what's been the actual vacancy rate?
- This sits on a lake — are riparian / water-frontage rights deeded with the parcel? Any dock permits, shoreline easements, or HOA water-use restrictions?
- What's the documented flood / surge / shoreline-erosion history here (FEMA AND non-FEMA — e.g., storm surge, creek backup, septic-field saturation)?
- Any water-quality or seasonal algae-bloom issues that affect tenant satisfaction or short-term-rental demand?
- What's the average days-on-market for RENTAL listings here right now (not sales)? A rising rental-DOM trend means longer vacancies and softer asking-rent achievability than the comps imply.
- What's the recent tenant-quality profile in this submarket — average credit score on applications, eviction rate, late-payment / NSF rate, and stable-employment percentage? A property-management company in the area should have these aggregated.
CashFlowRE · CFR-BNGFSR2RDFPVVV
· Data 2 days ago
cashflowre.app · 2026-05-29