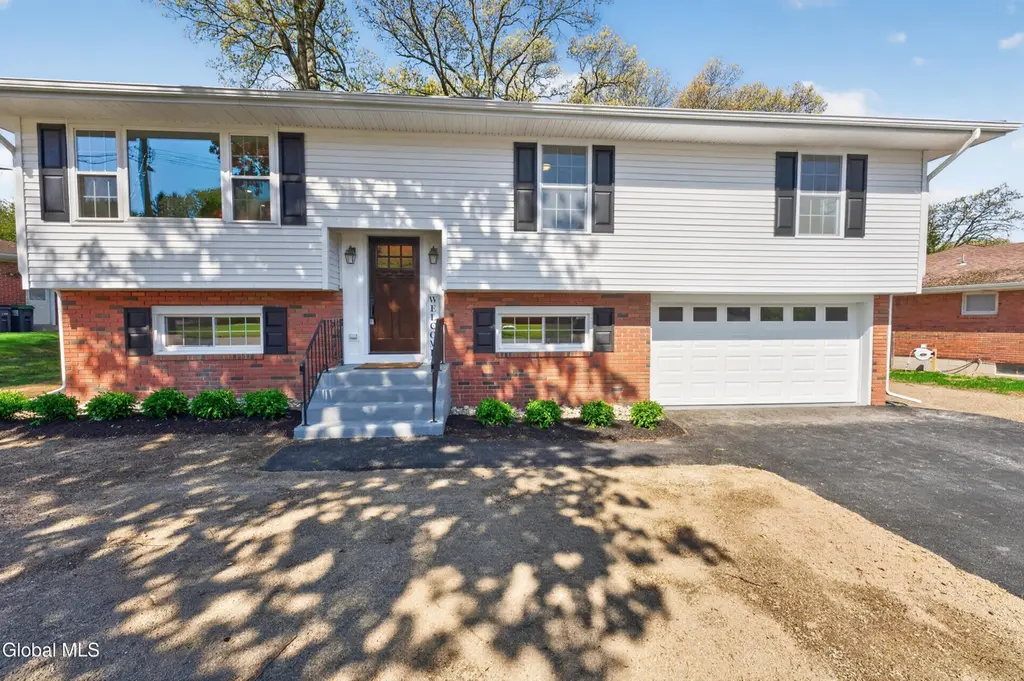
24 James Dr
Loudonville, NY 12211
$529,900C-
3 bd · 1.5 ba ·
2,068 sqft ·
Built 1960
· SingleFamily
· Pending
· 20 DOM
Cashflow @ list (25.0% down · 7.5%)
Estimated rent
$4,700/mo
Mortgage (P&I)
−$2,779
Tax + insurance
−$680
HOA
−$0
Vac / Maint / Mgmt
−$987
Net cashflow
$255/mo
Annual
$3,054/yr
Cap rate
6.87%
Cash-on-cash
2.06%
DSCR
1.09
1% rule
0.89%
Cash to close
$148,372
Investor read
- This is a 3-bed/1.5-bath single-family listed at $530k.
- At list price, monthly cash flow is $255 ($3k/yr) — positive.
- The deal already cash-flows at list — no discount required.
- To meet the 1% rule (rent ≥ 1% of price), the offer needs to be $470k (11.3% below list).
- It's been on market 20 days — a 2% lower offer ($522k) is reasonable based on typical stale-listing flexibility.
- Recommended offer: $470k (11.3% below list) — sets the bar for 1% rule.
- Local home prices are declining (-3.0%/yr); year-one equity from $4k of loan paydown is wiped out by about $16k of value loss. Plan a longer hold.
- Location reads: area grade C — affects rentability + tenant quality, not the cash-flow math above.
- South Colonie Central School District (suburban): math 63% / reading 57% proficiency, ranked #215 of 590 in NY (top 36%) — acceptable for families but not a draw, mixed tenant base, ~2y average lease; only 19% free/reduced lunch — higher-income household profile.
- Zoned schools: Colonie Central High School (math 96% / reading 72%, grade A, #404 of 1,100 statewide, top 37%, 1,538 students, 39% FRL) — zoned schools average 39% FRL vs 19% district-wide (20 pts higher); higher-poverty schools than district average — tighter screening recommended.
- Zoned-school proficiency averages 84% at this address vs 60% district-wide (+24 pts) — the actual schools serving this property are materially stronger than the South Colonie Central School District average implies; a family-tenant draw the district grade alone would hide.
- Market conditions: 39 active listings in the ZIP; 1 comparable units currently listed for rent nearby; 675 units permitted in Albany County in 2024 (451 in 5+ unit buildings).
- Albany County population projected at +9% by 2050 — modest demand growth; plan on rents tracking national, not racing it.
- 2 sale attempts with the ask held roughly flat each time — persistent listings suggest the price (not the market) is what's stuck; bring a comps-based counter.
- Current owner paid $282k; list at $530k implies a 88% gain — meaningful room to come down on a strong offer.
- Cap rate 6.9% vs local median 3.1% in Loudonville — top-decile yield for the area; either an underpriced asset or a hidden risk that comps aren't pricing in. Stress-test before assuming the spread holds.
Questions for listing agent
- Built in 1960 — when were the roof, HVAC, electrical panel, plumbing, and water heater last replaced?
- Is there a deadline driving the sale (1031 exchange, divorce, estate, relocation)? That informs how much negotiation room exists.
- What's the average days-on-market for RENTAL listings here right now (not sales)? A rising rental-DOM trend means longer vacancies and softer asking-rent achievability than the comps imply.
- What's the recent tenant-quality profile in this submarket — average credit score on applications, eviction rate, late-payment / NSF rate, and stable-employment percentage? A property-management company in the area should have these aggregated.
- How much new for-sale + rental construction is in the pipeline within 1–3 miles? Heavy new supply typically softens prices + rents 12–24 months out; constrained supply supports both.
CashFlowRE · CFR-BNJSTF2NF58CVC
· Data 2 weeks ago
cashflowre.app · 2026-05-29