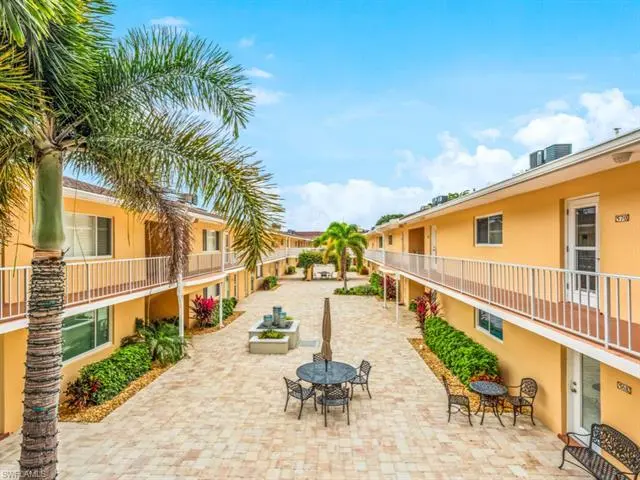
578 Broad Ave S #578
Naples, FL 34102
$475,000C
2 bd · 2.0 ba ·
890 sqft ·
Built 1973
· Condo
· Pending
· 12 DOM
Cashflow @ list (25.0% down · 7.5%)
Estimated rent
$5,101/mo
Mortgage (P&I)
−$2,491
Tax + insurance
−$972
HOA
−$679
Vac / Maint / Mgmt
−$1,071
Net cashflow
$-112/mo
Annual
$-1,349/yr
Cap rate
7.09%
Cash-on-cash
2.83%
DSCR
1.13
1% rule
1.07%
Cash to close
$133,000
Investor read
- This is a 2-bed/2.0-bath condo listed at $475k.
- At list price, monthly cash flow is $-112 ($-1k/yr) — negative.
- To cash-flow at today's rent, offer at most $455k (4.2% below list).
- Meets the 1% rule at list price ($5k rent vs $475k).
- Only 12 days on market — expect competitive offers; lowballing is unlikely to land.
- Recommended offer: $455k (4.2% below list) — sets the bar for cash-flow.
- In year one you build about $23k of equity ($3k loan paydown + $19k appreciation (4.1% local appreciation)).
- Location reads 80/100 on livability (#126 in FL, #1,903 nationally) — a professional / high-income tenant draw. Strengths: crime A+, amenities A+, employment A+; Watch: commute D+, cost of living F.
- Collier (suburban): math 60% / reading 56% proficiency, ranked #16 of 73 in FL (top 22%) — acceptable for families but not a draw, mixed tenant base, ~2y average lease.
- Watch-outs: flood insurance adds $427/mo.
- Market conditions: Rents rising fast (+8.8%/yr); 614 active listings in the ZIP; 40 comparable units currently listed for rent nearby; rentals at typical pace (median 24d on market — plan ~3-4 weeks tenant-placement turnaround); high-income renter base; 3,520 units permitted in Collier County in 2024 (959 in 5+ unit buildings).
- Collier County population projected at +30% by 2050 — long-run rental-demand tailwind backs the buy-and-hold thesis.
- 15 sale attempts since 18y ago with the ask held roughly flat each time — persistent listings suggest the price (not the market) is what's stuck; bring a comps-based counter.
- Current owner paid $255k; list at $475k implies a 86% gain — meaningful room to come down on a strong offer.
- By year 2, paydown + projected appreciation supports a ~$37k cash-out refi (75% LTV) — recoverable capital for the next deal without selling this one.
- Climate carrying-cost: in FEMA flood zone AE (mandatory federal flood insurance); severe wind risk, 99% chance of damaging wind over 30y; extreme-heat days projected 7→26/yr by 2055 (HVAC capex compounding) — expect insurance premiums to compound above CPI over the hold.
- At $5,101/mo this rent would consume 47% of the median local household income ($131k/yr) (locally 333% of renters already pay >50% of income on rent) — very limited rent-growth headroom before tenants either downsize or default.
Questions for listing agent
- What do current leases actually rent for vs. the listed asking? Can we see a recent rent roll and the last 12 months of T-12 income?
- Built in 1973 — when were the roof, HVAC, electrical panel, plumbing, and water heater last replaced?
- What's the actual annual flood-insurance premium (NFIP or private), and is the property in a SFHA with mandatory coverage?
- What does the HOA fee cover, when was the last increase, and are there any pending special assessments or reserve-fund shortfalls?
- Any open or pending special assessments — roof, HVAC, plumbing, elevator, façade? What's the per-unit balance and payoff schedule, and is the seller paying it off at close or rolling it to the buyer?
- Is there a deadline driving the sale (1031 exchange, divorce, estate, relocation)? That informs how much negotiation room exists.
- Schools are B-rated — typically a magnet for longer-tenancy family renters. What's the average tenant stay here, and is there a school-zone premium baked into asking?
- What's the average days-on-market for RENTAL listings here right now (not sales)? A rising rental-DOM trend means longer vacancies and softer asking-rent achievability than the comps imply.
CashFlowRE · CFR-BQQWYR3X2VATGC
· Data 6 days ago
cashflowre.app · 2026-05-29