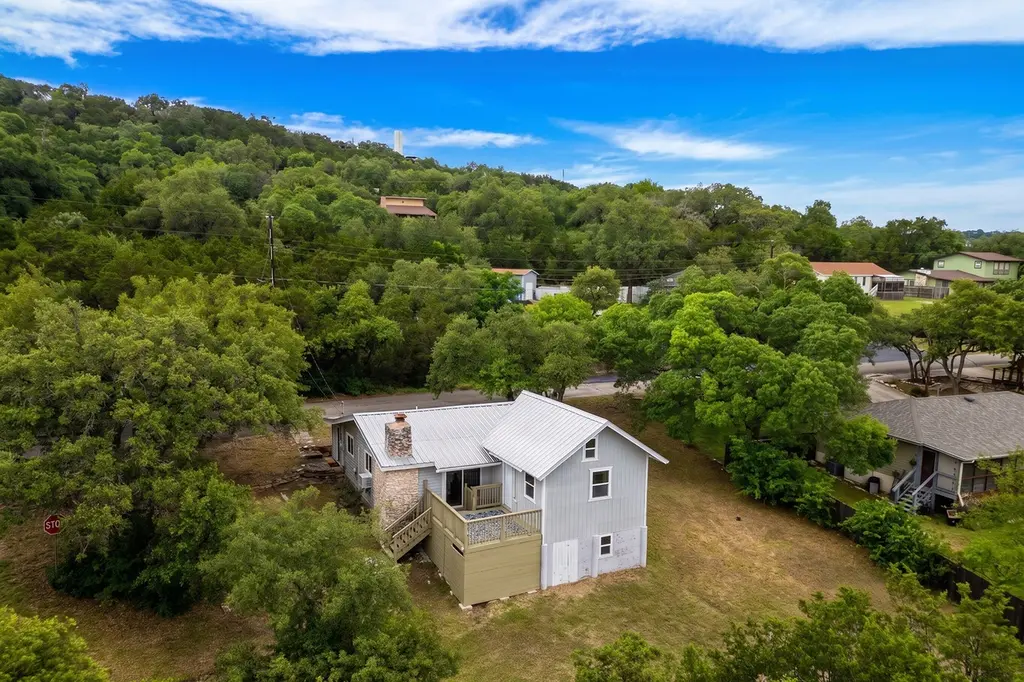
10913 Ridgeway St
Jonestown, TX 78645
$200,000C-
3 bd · 2.0 ba ·
1,232 sqft ·
Built 1958
· SingleFamily
· Active
· 29 DOM
Cashflow @ list (25.0% down · 7.5%)
Estimated rent
$2,034/mo
Mortgage (P&I)
−$1,049
Tax + insurance
−$579
HOA
−$0
Vac / Maint / Mgmt
−$427
Net cashflow
$-21/mo
Annual
$-253/yr
Cap rate
6.17%
Cash-on-cash
-0.45%
DSCR
0.98
1% rule
1.02%
Cash to close
$56,000
Investor read
- This is a 3-bed/2.0-bath single-family listed at $200k.
- At list price, monthly cash flow is $-21 ($-253/yr) — negative.
- To cash-flow at today's rent, offer at most $196k (1.9% below list).
- Meets the 1% rule at list price ($2k rent vs $200k).
- It's been on market 29 days — a 2% lower offer ($197k) is reasonable based on typical stale-listing flexibility.
- Recommended offer: $196k (1.9% below list) — sets the bar for cash-flow.
- Local home prices are declining (-3.0%/yr); year-one equity from $1k of loan paydown is wiped out by about $6k of value loss. Plan a longer hold.
- Location reads 65/100 on livability (#668 in TX) — a middle-class / working-renter tenant base. Strengths: employment A+, housing A+; Watch: amenities F, commute F, health & safety F.
- Leander ISD (suburban): math 50% / reading 54% proficiency, ranked #100 of 826 in TX (top 12%) — acceptable for families but not a draw, mixed tenant base, ~2y average lease; only 19% free/reduced lunch — higher-income household profile.
- Zoned schools: C C Mason El (math 34% / reading 44%, grade F, #1,651 of 4,322 statewide, top 39%, 636 students, 23% FRL); Running Brushy Middle (math 49% / reading 45%, grade D+, #424 of 1,662 statewide, top 27%, 1,052 students, 29% FRL); Leander H S (math 43% / reading 41%, grade F, #730 of 1,632 statewide, top 47%, 2,218 students, 25% FRL).
- Watch-outs: property tax is 3.0% of price; built in 1958 — expect roof / HVAC / electrical / plumbing capex.
- Market conditions: Rents rising (+3.0%/yr); 1101 active listings in the ZIP; 7 comparable units currently listed for rent nearby; rentals at typical pace (median 26d on market — plan ~3-4 weeks tenant-placement turnaround); 43% of comp listings sitting > 30 days — soft ceiling on asking rent; high-income renter base; 17,121 units permitted in Travis County in 2024 (11,963 in 5+ unit buildings).
- Travis County population projected at +60% by 2050 — long-run rental-demand tailwind backs the buy-and-hold thesis.
- 4 sale attempts since 10y ago with the ask held roughly flat each time — persistent listings suggest the price (not the market) is what's stuck; bring a comps-based counter.
- Climate carrying-cost: major wind risk, 69% chance of damaging wind over 30y; extreme-heat days projected 7→23/yr by 2055 (HVAC capex compounding) — expect insurance premiums to compound above CPI over the hold.
- Cap rate 6.2% vs local median 0.6% in Jonestown — top-decile yield for the area; either an underpriced asset or a hidden risk that comps aren't pricing in. Stress-test before assuming the spread holds.
Questions for listing agent
- What do current leases actually rent for vs. the listed asking? Can we see a recent rent roll and the last 12 months of T-12 income?
- Built in 1958 — when were the roof, HVAC, electrical panel, plumbing, and water heater last replaced?
- Property tax is high relative to price — has the assessment been appealed recently, and will the sale trigger a re-assessment?
- Is there a deadline driving the sale (1031 exchange, divorce, estate, relocation)? That informs how much negotiation room exists.
- Schools are F-rated, which usually means shorter tenancies and higher turnover. Who's the typical renter profile here, and what's been the actual vacancy rate?
- What's the average days-on-market for RENTAL listings here right now (not sales)? A rising rental-DOM trend means longer vacancies and softer asking-rent achievability than the comps imply.
- What's the recent tenant-quality profile in this submarket — average credit score on applications, eviction rate, late-payment / NSF rate, and stable-employment percentage? A property-management company in the area should have these aggregated.
- How much new for-sale + rental construction is in the pipeline within 1–3 miles? Heavy new supply typically softens prices + rents 12–24 months out; constrained supply supports both.
CashFlowRE · CFR-BSVYXFFB45XDXF
· Data 1 day ago
cashflowre.app · 2026-05-29