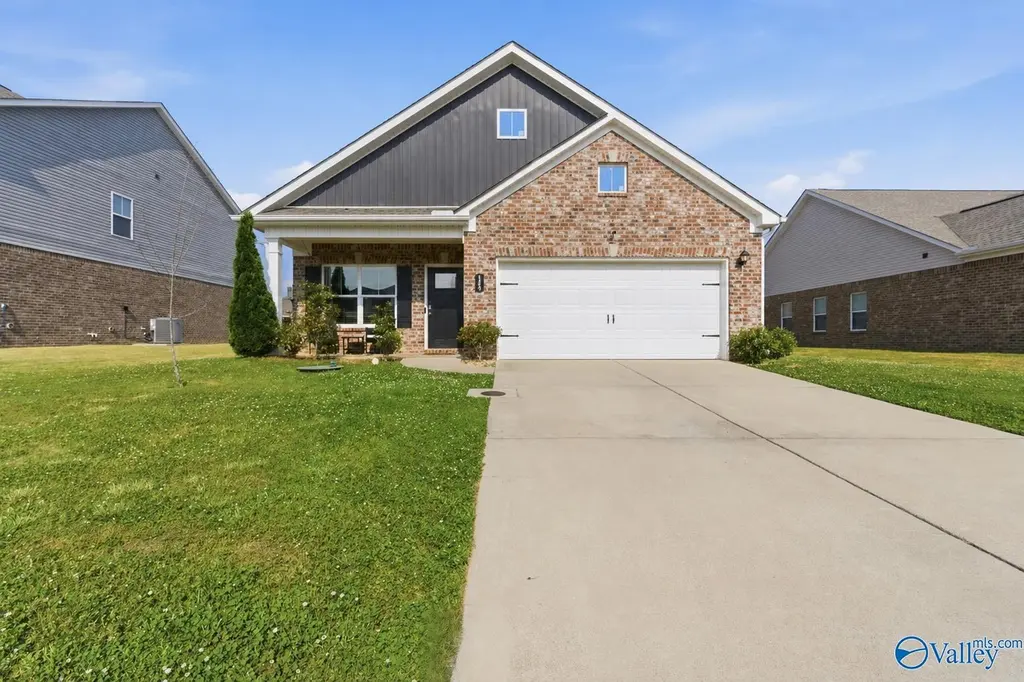
149 Morning Dew Rd
Huntsville, AL 35773
$275,000C-
3 bd · 1.0 ba ·
1,570 sqft ·
Built 2022
· SingleFamily
· Active
· 49 DOM
Cashflow @ list (25.0% down · 7.5%)
Estimated rent
$2,100/mo
Mortgage (P&I)
−$1,442
Tax + insurance
−$280
HOA
−$29
Vac / Maint / Mgmt
−$441
Net cashflow
$-92/mo
Annual
$-1,101/yr
Cap rate
5.89%
Cash-on-cash
-1.43%
DSCR
0.94
1% rule
0.76%
Cash to close
$77,000
Investor read
- This is a 3-bed/1.0-bath single-family listed at $275k.
- At list price, monthly cash flow is $-92 ($-1k/yr) — negative.
- To cash-flow at today's rent, offer at most $259k (5.9% below list).
- To meet the 1% rule (rent ≥ 1% of price), the offer needs to be $210k (23.6% below list).
- It's been on market 49 days — a 3% lower offer ($267k) is reasonable based on typical stale-listing flexibility.
- Recommended offer: $210k (23.6% below list) — sets the bar for 1% rule.
- In year one you build about $29k of equity ($2k loan paydown + $28k appreciation (10.0% local appreciation)).
- Location reads 82/100 on livability (#3 in AL, #1,082 nationally) — a professional / high-income tenant draw. Strengths: commute A+, cost of living A+, housing A+; Watch: crime F.
- Madison County (rural): math 27% / reading 56% proficiency, ranked #19 of 129 in AL (top 15%) — families likely to look elsewhere, expect single-tenant / working-renter base with shorter leases.
- Zoned schools: Madison Cross Roads Elementary School (math 14% / reading 48%, grade F, #360 of 627 statewide, top 58%, 1,035 students, 59% FRL); Sparkman Middle School (math 18% / reading 53%, grade F, #81 of 257 statewide, top 33%, 859 students, 60% FRL); Sparkman High School (math 28% / reading 37%, grade F, #58 of 305 statewide, top 19%, 1,738 students, 37% FRL) — zoned schools average 52% FRL vs 29% district-wide (23 pts higher); higher-poverty schools than district average — tighter screening recommended.
- Market conditions: 319 active listings in the ZIP; 1 comparable units currently listed for rent nearby; 4,709 units permitted in Madison County in 2024 (1,186 in 5+ unit buildings).
- Madison County population projected at +18% by 2050 — long-run rental-demand tailwind backs the buy-and-hold thesis.
- 3 sale attempts since 5y ago with the ask held roughly flat each time — persistent listings suggest the price (not the market) is what's stuck; bring a comps-based counter.
- By year 2, paydown + projected appreciation supports a ~$47k cash-out refi (75% LTV) — recoverable capital for the next deal without selling this one.
- Cap rate 5.9% vs local median 3.8% in Huntsville — top-decile yield for the area; either an underpriced asset or a hidden risk that comps aren't pricing in. Stress-test before assuming the spread holds.
Questions for listing agent
- What do current leases actually rent for vs. the listed asking? Can we see a recent rent roll and the last 12 months of T-12 income?
- It's been on market 49 days. Have you received any prior offers? Is the seller open to a 24% concession, seller financing, or rate buy-down credit?
- What does the HOA fee cover, when was the last increase, and are there any pending special assessments or reserve-fund shortfalls?
- Is there a deadline driving the sale (1031 exchange, divorce, estate, relocation)? That informs how much negotiation room exists.
- Crime grade is F in this area — have there been break-ins, vandalism, or insurance claims at this property in the last 3 years? What carrier currently insures it and at what premium?
- What's the average days-on-market for RENTAL listings here right now (not sales)? A rising rental-DOM trend means longer vacancies and softer asking-rent achievability than the comps imply.
- What's the recent tenant-quality profile in this submarket — average credit score on applications, eviction rate, late-payment / NSF rate, and stable-employment percentage? A property-management company in the area should have these aggregated.
- How much new for-sale + rental construction is in the pipeline within 1–3 miles? Heavy new supply typically softens prices + rents 12–24 months out; constrained supply supports both.
CashFlowRE · CFR-BTGP5Q5R2388ZK
· Data 3 days ago
cashflowre.app · 2026-05-29