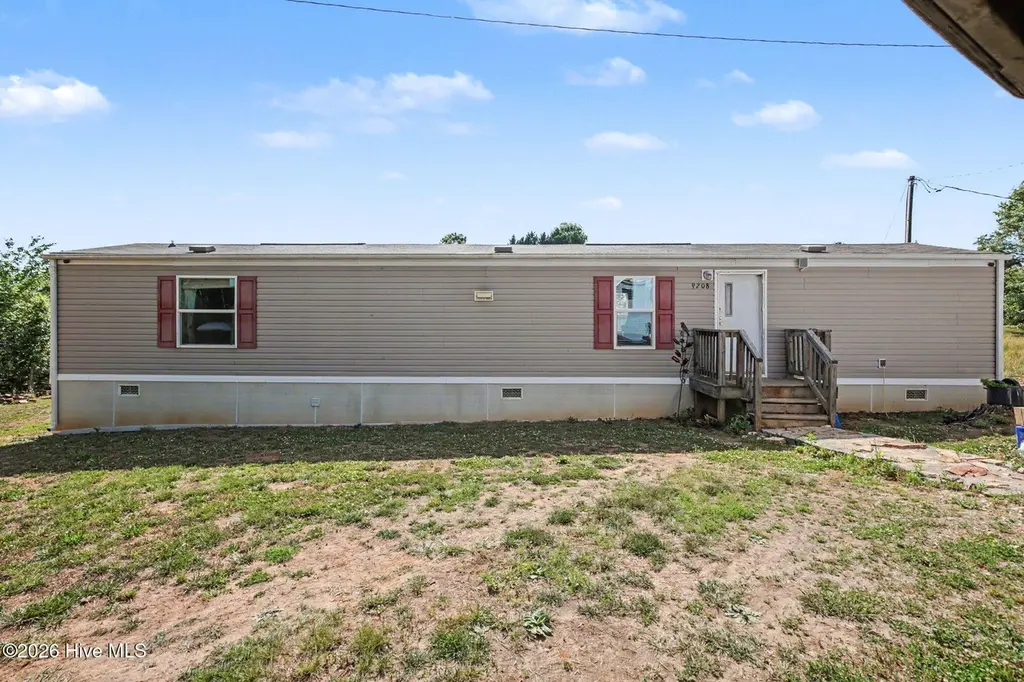
9208 Carolina 87
Wentworth, NC 27320
$69,900B-
2 bd · 2.0 ba ·
842 sqft ·
Built 2019
· Manufactured
· Active
· 8 DOM
Cashflow @ list (25.0% down · 7.5%)
Estimated rent
$1,033/mo
Mortgage (P&I)
−$367
Tax + insurance
−$47
HOA
−$0
Vac / Maint / Mgmt
−$217
Net cashflow
$402/mo
Annual
$4,823/yr
Cap rate
13.19%
Cash-on-cash
24.64%
DSCR
2.10
1% rule
1.48%
Cash to close
$19,572
Investor read
- This is a 2-bed/2.0-bath manufactured listed at $70k.
- At list price, monthly cash flow is $402 ($5k/yr) — positive.
- The deal already cash-flows at list — no discount required.
- Meets the 1% rule at list price ($1k rent vs $70k).
- Only 8 days on market — expect competitive offers; lowballing is unlikely to land.
- Local home prices are declining (-3.0%/yr); year-one equity from $483 of loan paydown is wiped out by about $2k of value loss. Plan a longer hold.
- Location reads 69/100 on livability (#168 in NC) — a middle-class / working-renter tenant base. Strengths: cost of living A+, housing A+, crime A; Watch: amenities F, commute F, health & safety F.
- Rockingham County Schools (rural): math 38% / reading 40% proficiency, ranked #120 of 178 in NC (top 67%) — families likely to look elsewhere, expect single-tenant / working-renter base with shorter leases.
- Zoned schools: Williamsburg Elementary (math 40% / reading 36%, grade F, #759 of 1,410 statewide, top 54%, 502 students, 99% FRL); Reidsville Middle (math 27% / reading 33%, grade F, #335 of 475 statewide, top 72%, 614 students, 100% FRL); Reidsville High (math 42% / reading 32%, grade F, #414 of 535 statewide, top 79%, 753 students, 100% FRL) — zoned schools average 100% FRL vs 52% district-wide (48 pts higher); higher-poverty schools than district average — tighter screening recommended.
- Market conditions: 251 active listings in the ZIP; 344 units permitted in Rockingham County in 2024 (0 in 5+ unit buildings).
- Rockingham County population projected at -22% by 2050 — secular population decline; favor cash flow + early exit over multi-decade hold.
- At projected returns (-3.0% appreciation + 3.0% rent growth), your $20k cash investment doubles in ~5 years — after that, you're playing with house money.
- Climate carrying-cost: extreme-heat days projected 7→18/yr by 2055 (HVAC capex compounding) — expect insurance premiums to compound above CPI over the hold.
- Cap rate 13.2% vs local median 2.7% in Wentworth — top-decile yield for the area; either an underpriced asset or a hidden risk that comps aren't pricing in. Stress-test before assuming the spread holds.
Questions for listing agent
- Is there a deadline driving the sale (1031 exchange, divorce, estate, relocation)? That informs how much negotiation room exists.
- Schools are B-rated — typically a magnet for longer-tenancy family renters. What's the average tenant stay here, and is there a school-zone premium baked into asking?
- What's the average days-on-market for RENTAL listings here right now (not sales)? A rising rental-DOM trend means longer vacancies and softer asking-rent achievability than the comps imply.
- What's the recent tenant-quality profile in this submarket — average credit score on applications, eviction rate, late-payment / NSF rate, and stable-employment percentage? A property-management company in the area should have these aggregated.
- How much new for-sale + rental construction is in the pipeline within 1–3 miles? Heavy new supply typically softens prices + rents 12–24 months out; constrained supply supports both.
CashFlowRE · CFR-BTZ04Z1TMPRD9C
· Data 1 week ago
cashflowre.app · 2026-05-29