11 Woodland Ave Unit C
West Hartford, CT 06002
$246,000D-
2 bd · 1.5 ba ·
1,368 sqft ·
Built 1971
· Condo
· Active
· 3 DOM
Cashflow @ list (25.0% down · 7.5%)
Estimated rent
$2,621/mo
Mortgage (P&I)
−$1,290
Tax + insurance
−$504
HOA
−$370
Vac / Maint / Mgmt
−$550
Net cashflow
$-94/mo
Annual
$-1,128/yr
Cap rate
5.83%
Cash-on-cash
-1.64%
DSCR
0.93
1% rule
1.07%
Cash to close
$68,880
Investor read
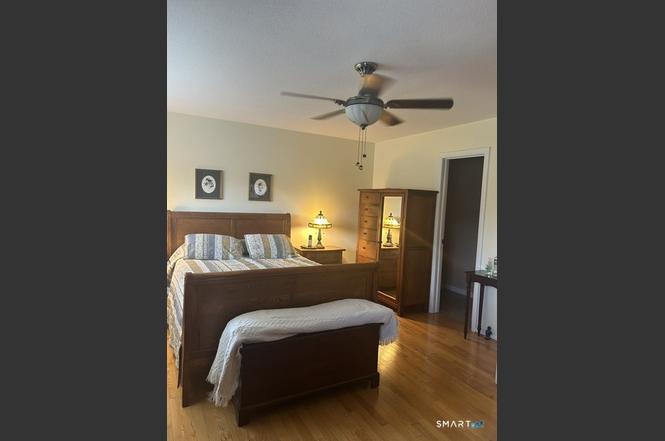
- This is a 2-bed/1.5-bath condo listed at $246k.
- At list price, monthly cash flow is $-94 ($-1k/yr) — negative.
- To cash-flow at today's rent, offer at most $229k (6.7% below list).
- Meets the 1% rule at list price ($3k rent vs $246k).
- Only 3 days on market — expect competitive offers; lowballing is unlikely to land.
- Recommended offer: $229k (6.7% below list) — sets the bar for cash-flow.
- Local home prices are declining (-3.0%/yr); year-one equity from $2k of loan paydown is wiped out by about $7k of value loss. Plan a longer hold.
- Location reads 79/100 on livability (#27 in CT, #1,989 nationally) — a middle-class / working-renter tenant base. Strengths: employment A+, housing A+, crime B+; Watch: amenities F, cost of living F.
- Bloomfield School District (suburban): math 16% / reading 30% proficiency, ranked #137 of 153 in CT (top 90%) — low school quality limits family demand, transient renter base, plan for 1-2y turnover.
- Zoned schools: Laurel School (307 students, 67% FRL); Carmen Arace Middle School (math 19% / reading 30%, grade F, #153 of 175 statewide, top 88%, 246 students, 61% FRL); Bloomfield High School (math 17% / reading 47%, grade F, #129 of 194 statewide, top 69%, 525 students, 58% FRL) — zoned schools average 62% FRL vs 44% district-wide (17 pts higher); higher-poverty schools than district average — tighter screening recommended.
- Market conditions: Rents rising (+3.1%/yr); 67 active listings in the ZIP; 6 comparable units currently listed for rent nearby; rentals lingering (median 46d on market — plan ~5-8 weeks vacancy on turnover, expect pricing pressure); 50% of comp listings sitting > 30 days — soft ceiling on asking rent; solid renter incomes; 1,867 units permitted in Capitol Planning Region in 2024 (1,399 in 5+ unit buildings).
- 3 sale attempts since 26y ago with the ask held roughly flat each time — persistent listings suggest the price (not the market) is what's stuck; bring a comps-based counter.
- Current owner paid $108k; list at $246k implies a 128% gain — meaningful room to come down on a strong offer.
- Cap rate 5.8% vs local median 3.3% in West Hartford — top-decile yield for the area; either an underpriced asset or a hidden risk that comps aren't pricing in. Stress-test before assuming the spread holds.
- This rent runs 32% of the median local income ($98k/yr) — at the standard rent-burdened threshold; future hikes will face affordability resistance.
Questions for listing agent
- What do current leases actually rent for vs. the listed asking? Can we see a recent rent roll and the last 12 months of T-12 income?
- Built in 1971 — when were the roof, HVAC, electrical panel, plumbing, and water heater last replaced?
- What does the HOA fee cover, when was the last increase, and are there any pending special assessments or reserve-fund shortfalls?
- Any open or pending special assessments — roof, HVAC, plumbing, elevator, façade? What's the per-unit balance and payoff schedule, and is the seller paying it off at close or rolling it to the buyer?
- Is there a deadline driving the sale (1031 exchange, divorce, estate, relocation)? That informs how much negotiation room exists.
- Schools are A-rated — typically a magnet for longer-tenancy family renters. What's the average tenant stay here, and is there a school-zone premium baked into asking?
- The area grade is low — what's the realistic commute time and amenity access for the typical tenant pool here? Any planned neighborhood developments (good or bad) we should know about?
- What's the average days-on-market for RENTAL listings here right now (not sales)? A rising rental-DOM trend means longer vacancies and softer asking-rent achievability than the comps imply.
CashFlowRE · CFR-BVKNTEA4M9VMDA
· Data 15 h ago
cashflowre.app · 2026-05-29