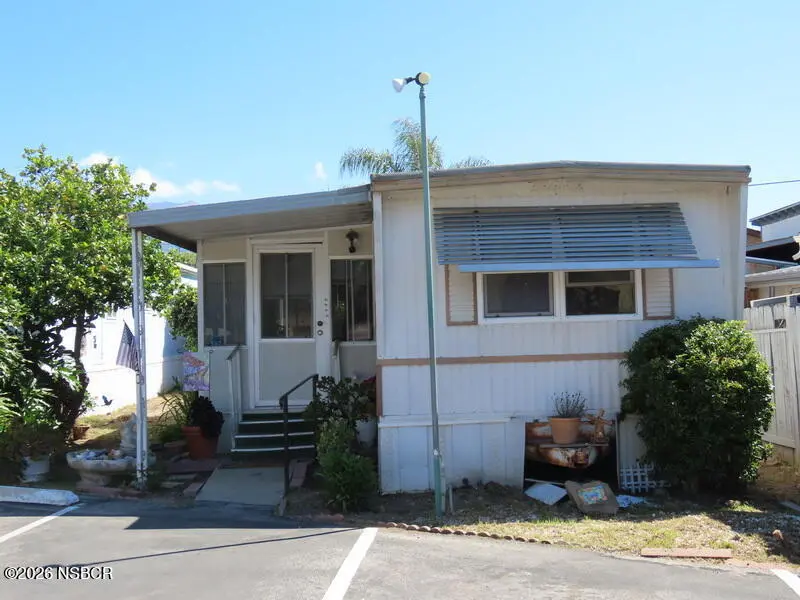
4326 Calle Real #140
Eastern Goleta Valley, CA 93110
$275,000C-
1 bd · 1.0 ba ·
624 sqft ·
Built 1970
· Manufactured
· Pending
· 31 DOM
Cashflow @ list (25.0% down · 7.5%)
Estimated rent
$2,629/mo
Mortgage (P&I)
−$1,442
Tax + insurance
−$885
HOA
−$0
Vac / Maint / Mgmt
−$552
Net cashflow
$-250/mo
Annual
$-3,003/yr
Cap rate
7.06%
Cash-on-cash
2.75%
DSCR
1.12
1% rule
0.96%
Cash to close
$77,000
Investor read
- This is a 1-bed/1.0-bath manufactured listed at $275k.
- At list price, monthly cash flow is $-250 ($-3k/yr) — negative.
- To cash-flow at today's rent, offer at most $239k (13.2% below list).
- To meet the 1% rule (rent ≥ 1% of price), the offer needs to be $263k (4.4% below list).
- It's been on market 31 days — a 3% lower offer ($267k) is reasonable based on typical stale-listing flexibility.
- Recommended offer: $239k (13.2% below list) — sets the bar for cash-flow.
- In year one you build about $13k of equity ($2k loan paydown + $11k appreciation (4.0% local appreciation)).
- Location reads: area grade C — affects rentability + tenant quality, not the cash-flow math above.
- Zoned schools: Hope Elementary (269 students, 43% FRL); La Colina Junior High (900 students, 42% FRL).
- Watch-outs: flood insurance adds $427/mo.
- Market conditions: 49 active listings in the ZIP; 1 comparable units currently listed for rent nearby; high-income renter base; 719 units permitted in Santa Barbara County in 2024 (217 in 5+ unit buildings).
- Santa Barbara County population projected at +20% by 2050 — long-run rental-demand tailwind backs the buy-and-hold thesis.
- 4 sale attempts with the ask held roughly flat each time — persistent listings suggest the price (not the market) is what's stuck; bring a comps-based counter.
- By year 3, paydown + projected appreciation supports a ~$32k cash-out refi (75% LTV) — recoverable capital for the next deal without selling this one.
- Climate carrying-cost: in FEMA flood zone AE (mandatory federal flood insurance); moderate wildfire risk; extreme-heat days projected 10→26/yr by 2055 (HVAC capex compounding) — expect insurance premiums to compound above CPI over the hold.
- Cap rate 7.1% vs local median 1.2% in Eastern Goleta Valley — top-decile yield for the area; either an underpriced asset or a hidden risk that comps aren't pricing in. Stress-test before assuming the spread holds.
Questions for listing agent
- What do current leases actually rent for vs. the listed asking? Can we see a recent rent roll and the last 12 months of T-12 income?
- It's been on market 31 days. Have you received any prior offers? Is the seller open to a 13% concession, seller financing, or rate buy-down credit?
- Built in 1970 — when were the roof, HVAC, electrical panel, plumbing, and water heater last replaced?
- What's the actual annual flood-insurance premium (NFIP or private), and is the property in a SFHA with mandatory coverage?
- Is there a deadline driving the sale (1031 exchange, divorce, estate, relocation)? That informs how much negotiation room exists.
- What's the average days-on-market for RENTAL listings here right now (not sales)? A rising rental-DOM trend means longer vacancies and softer asking-rent achievability than the comps imply.
- What's the recent tenant-quality profile in this submarket — average credit score on applications, eviction rate, late-payment / NSF rate, and stable-employment percentage? A property-management company in the area should have these aggregated.
- How much new for-sale + rental construction is in the pipeline within 1–3 miles? Heavy new supply typically softens prices + rents 12–24 months out; constrained supply supports both.
CashFlowRE · CFR-BWR5MD3WHJXP6Q
· Data 1 week ago
cashflowre.app · 2026-05-29