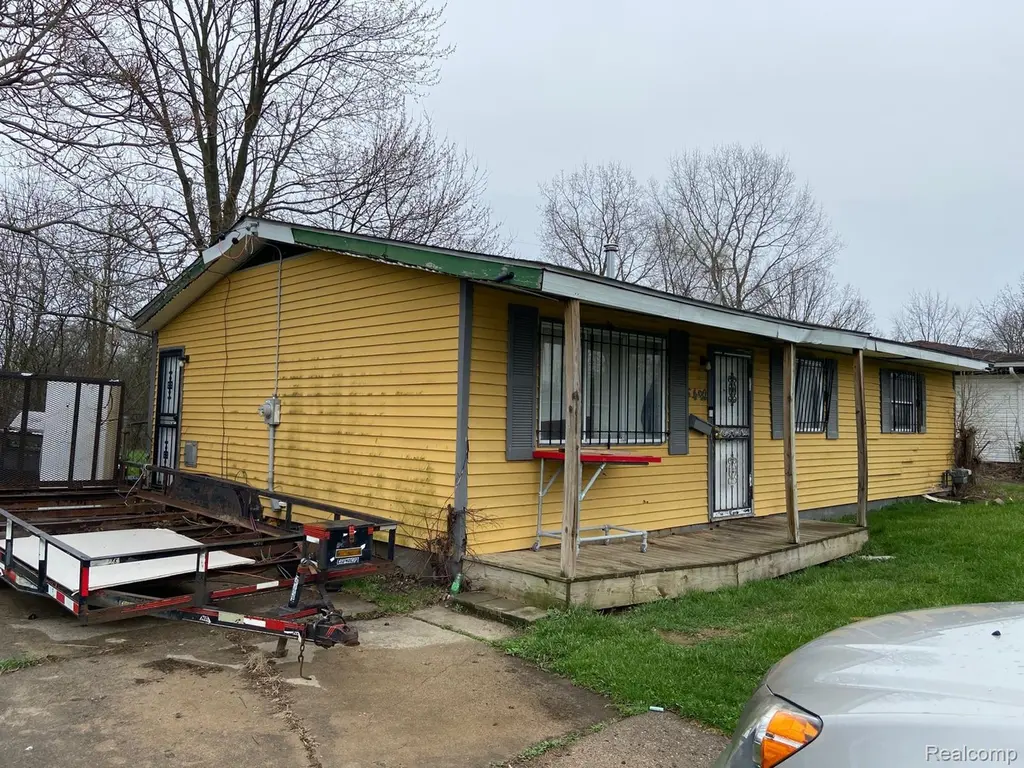
5492 Mendel Berger Dr
Mount Morris, MI 48505
$24,900C-
3 bd · 1.0 ba ·
1,100 sqft ·
Built 1975
· SingleFamily
· Active
· 40 DOM
Cashflow @ list (25.0% down · 7.5%)
Estimated rent
$1,040/mo
Mortgage (P&I)
−$131
Tax + insurance
−$42
HOA
−$0
Vac / Maint / Mgmt
−$218
Net cashflow
$649/mo
Annual
$7,790/yr
Cap rate
37.58%
Cash-on-cash
111.73%
DSCR
5.97
1% rule
4.17%
Cash to close
$6,972
Investor read
- This is a 3-bed/1.0-bath single-family listed at $25k.
- At list price, monthly cash flow is $649 ($8k/yr) — positive.
- The deal already cash-flows at list — no discount required.
- Meets the 1% rule at list price ($1k rent vs $25k).
- It's been on market 40 days — a 3% lower offer ($24k) is reasonable based on typical stale-listing flexibility.
- Recommended offer: $24k (3.0% below list) — sets the bar for market timing.
- In year one you build about $838 of equity ($172 loan paydown + $666 appreciation (2.7% local appreciation)).
- Location reads 68/100 on livability (#357 in MI) — a middle-class / working-renter tenant base. Strengths: cost of living A+, housing A+, health & safety A+; Watch: schools F, crime F, amenities F.
- Beecher Community School District (suburban): math 7% / reading 10% proficiency, ranked #722 of 760 in MI (top 95%) — low school quality limits family demand, transient renter base, plan for 1-2y turnover; 90% free/reduced lunch — lower-income household profile, screen leases tightly.
- Market conditions: 100 active listings in the ZIP; 10 comparable units currently listed for rent nearby; rentals at typical pace (median 15d on market — plan ~3-4 weeks tenant-placement turnaround); lower-income renter base — watch delinquency; 419 units permitted in Genesee County in 2024 (68 in 5+ unit buildings).
- Genesee County population projected at -27% by 2050 — secular population decline; favor cash flow + early exit over multi-decade hold.
- 3 sale attempts; this cycle's ask has dropped $10k (28%) from the opening price — seller is motivated, your offer sets the floor, not the list.
- At projected returns (2.7% appreciation + 3.0% rent growth), your $7k cash investment doubles in ~1 year — after that, you're playing with house money.
- Cap rate 37.6% vs local median 3.5% in Mount Morris — top-decile yield for the area; either an underpriced asset or a hidden risk that comps aren't pricing in. Stress-test before assuming the spread holds.
- This rent runs 37% of the median local income ($33k/yr) — at the standard rent-burdened threshold; future hikes will face affordability resistance.
Questions for listing agent
- It's been on market 40 days. Have you received any prior offers? Is the seller open to a 3% concession, seller financing, or rate buy-down credit?
- Built in 1975 — when were the roof, HVAC, electrical panel, plumbing, and water heater last replaced?
- Is there a deadline driving the sale (1031 exchange, divorce, estate, relocation)? That informs how much negotiation room exists.
- Schools are F-rated, which usually means shorter tenancies and higher turnover. Who's the typical renter profile here, and what's been the actual vacancy rate?
- Crime grade is F in this area — have there been break-ins, vandalism, or insurance claims at this property in the last 3 years? What carrier currently insures it and at what premium?
- What's the average days-on-market for RENTAL listings here right now (not sales)? A rising rental-DOM trend means longer vacancies and softer asking-rent achievability than the comps imply.
- What's the recent tenant-quality profile in this submarket — average credit score on applications, eviction rate, late-payment / NSF rate, and stable-employment percentage? A property-management company in the area should have these aggregated.
- How much new for-sale + rental construction is in the pipeline within 1–3 miles? Heavy new supply typically softens prices + rents 12–24 months out; constrained supply supports both.
CashFlowRE · CFR-BZG86909S6TX0G
· Data 3 weeks ago
cashflowre.app · 2026-05-29