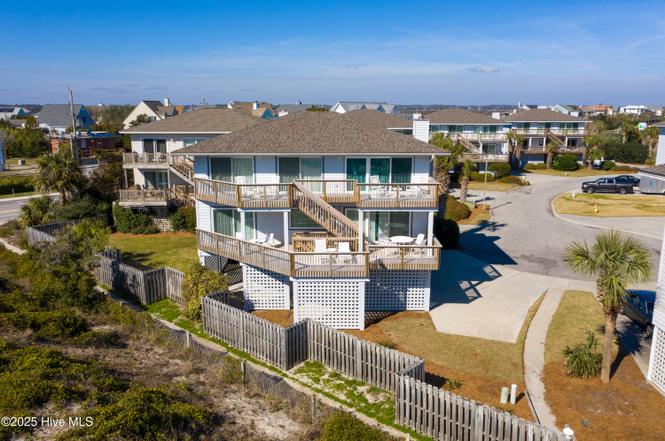
5 Sea Oats Ln
Wrightsville Beach, NC 28480
$285,000B+
4 bd · 3.0 ba ·
2,290 sqft ·
Built 1982
· SingleFamily
· Active
· 1 DOM
Cashflow @ list (25.0% down · 7.5%)
Estimated rent
$4,160/mo
Mortgage (P&I)
−$1,495
Tax + insurance
−$935
HOA
−$0
Vac / Maint / Mgmt
−$874
Net cashflow
$857/mo
Annual
$10,282/yr
Cap rate
11.84%
Cash-on-cash
19.81%
DSCR
1.88
1% rule
1.46%
Cash to close
$79,800
Investor read
- This is a 4-bed/3.0-bath single-family listed at $285k.
- At list price, monthly cash flow is $857 ($10k/yr) — positive.
- The deal already cash-flows at list — no discount required.
- Meets the 1% rule at list price ($4k rent vs $285k).
- Only 1 days on market — expect competitive offers; lowballing is unlikely to land.
- In year one you build about $19k of equity ($2k loan paydown + $17k appreciation (6.0% local appreciation)).
- Location reads 61/100 on livability (#501 in NC) — a middle-class / working-renter tenant base. Strengths: employment A+, schools B; Watch: housing C-, crime D+, health & safety D.
- New Hanover County Schools (urban): math 48% / reading 53% proficiency, ranked #61 of 178 in NC (top 34%) — acceptable for families but not a draw, mixed tenant base, ~2y average lease.
- Watch-outs: flood insurance adds $460/mo.
- Market conditions: 52 active listings in the ZIP; 2,581 units permitted in New Hanover County in 2024 (1,185 in 5+ unit buildings).
- New Hanover County population projected at +37% by 2050 — long-run rental-demand tailwind backs the buy-and-hold thesis.
- 7 sale attempts since 6y ago with the ask held roughly flat each time — persistent listings suggest the price (not the market) is what's stuck; bring a comps-based counter.
- At projected returns (6.0% appreciation + 3.0% rent growth), your $80k cash investment doubles in ~3 years — after that, you're playing with house money.
- By year 2, paydown + projected appreciation supports a ~$31k cash-out refi (75% LTV) — recoverable capital for the next deal without selling this one.
- Climate carrying-cost: in FEMA flood zone AE (mandatory federal flood insurance); severe wind risk, 99% chance of damaging wind over 30y; extreme-heat days projected 7→21/yr by 2055 (HVAC capex compounding) — expect insurance premiums to compound above CPI over the hold.
- Cap rate 11.8% vs local median 0.2% in Wrightsville Beach — top-decile yield for the area; either an underpriced asset or a hidden risk that comps aren't pricing in. Stress-test before assuming the spread holds.
Questions for listing agent
- What's the actual annual flood-insurance premium (NFIP or private), and is the property in a SFHA with mandatory coverage?
- Is there a deadline driving the sale (1031 exchange, divorce, estate, relocation)? That informs how much negotiation room exists.
- Schools are B-rated — typically a magnet for longer-tenancy family renters. What's the average tenant stay here, and is there a school-zone premium baked into asking?
- Crime grade is D in this area — have there been break-ins, vandalism, or insurance claims at this property in the last 3 years? What carrier currently insures it and at what premium?
- What's the average days-on-market for RENTAL listings here right now (not sales)? A rising rental-DOM trend means longer vacancies and softer asking-rent achievability than the comps imply.
- What's the recent tenant-quality profile in this submarket — average credit score on applications, eviction rate, late-payment / NSF rate, and stable-employment percentage? A property-management company in the area should have these aggregated.
- How much new for-sale + rental construction is in the pipeline within 1–3 miles? Heavy new supply typically softens prices + rents 12–24 months out; constrained supply supports both.
CashFlowRE · CFR-C24THB45Q13EBJ
· Data 3 days ago
cashflowre.app · 2026-05-29