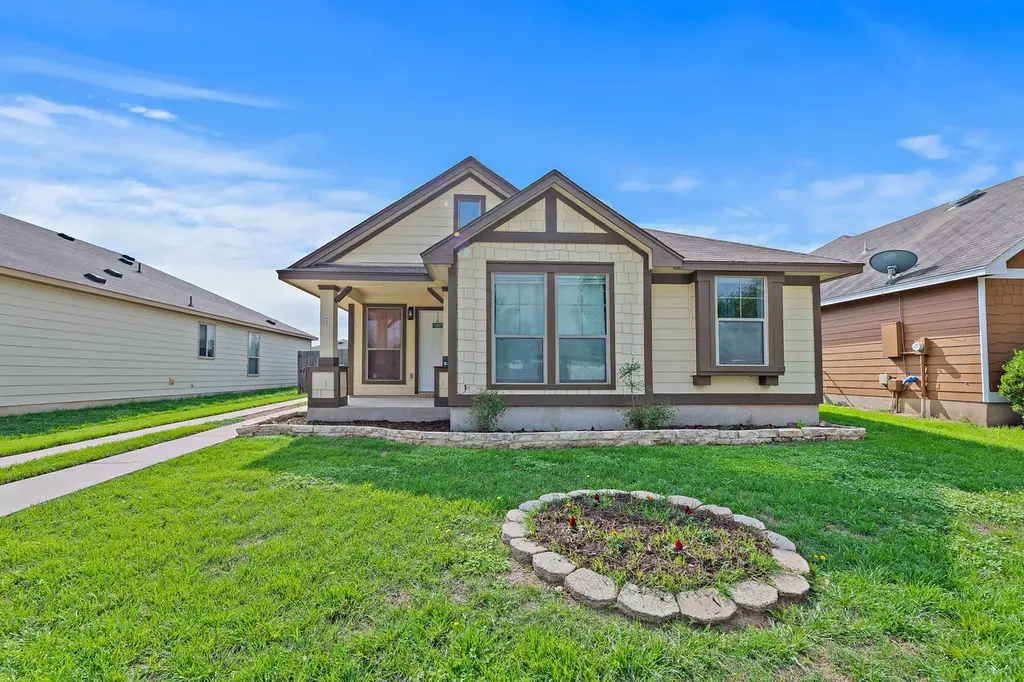
4603 Halliday Ave
Hornsby Bend, TX 78725
$257,500D-
3 bd · 2.0 ba ·
1,236 sqft ·
Built 2009
· SingleFamily
· Active
· 48 DOM
Cashflow @ list (25.0% down · 7.5%)
Estimated rent
$1,918/mo
Mortgage (P&I)
−$1,350
Tax + insurance
−$401
HOA
−$28
Vac / Maint / Mgmt
−$403
Net cashflow
$-264/mo
Annual
$-3,170/yr
Cap rate
5.06%
Cash-on-cash
-4.40%
DSCR
0.80
1% rule
0.74%
Cash to close
$72,100
Investor read
- This is a 3-bed/2.0-bath single-family listed at $258k.
- At list price, monthly cash flow is $-264 ($-3k/yr) — negative.
- To cash-flow at today's rent, offer at most $211k (18.1% below list).
- To meet the 1% rule (rent ≥ 1% of price), the offer needs to be $192k (25.5% below list).
- It's been on market 48 days — a 3% lower offer ($250k) is reasonable based on typical stale-listing flexibility.
- Recommended offer: $192k (25.5% below list) — sets the bar for 1% rule.
- Local home prices are declining (-3.0%/yr); year-one equity from $2k of loan paydown is wiped out by about $8k of value loss. Plan a longer hold.
- Location reads 61/100 on livability (#1,004 in TX) — a middle-class / working-renter tenant base. Strengths: housing A+, cost of living A, employment A-; Watch: schools F, amenities F, commute F.
- Del Valle ISD (rural): math 19% / reading 26% proficiency, ranked #749 of 826 in TX (top 91%) — low school quality limits family demand, transient renter base, plan for 1-2y turnover; 77% free/reduced lunch — lower-income household profile, screen leases tightly.
- Market conditions: Rents soft (-0.5%/yr); 96 active listings in the ZIP; 37 comparable units currently listed for rent nearby; rentals at typical pace (median 25d on market — plan ~3-4 weeks tenant-placement turnaround); solid renter incomes; 17,121 units permitted in Travis County in 2024 (11,963 in 5+ unit buildings).
- Travis County population projected at +60% by 2050 — long-run rental-demand tailwind backs the buy-and-hold thesis.
- 4 sale attempts since 13y ago with the ask held roughly flat each time — persistent listings suggest the price (not the market) is what's stuck; bring a comps-based counter.
- Climate carrying-cost: severe wind risk, 80% chance of damaging wind over 30y; extreme-heat days projected 7→25/yr by 2055 (HVAC capex compounding) — expect insurance premiums to compound above CPI over the hold.
Questions for listing agent
- What do current leases actually rent for vs. the listed asking? Can we see a recent rent roll and the last 12 months of T-12 income?
- It's been on market 48 days. Have you received any prior offers? Is the seller open to a 26% concession, seller financing, or rate buy-down credit?
- What does the HOA fee cover, when was the last increase, and are there any pending special assessments or reserve-fund shortfalls?
- Is there a deadline driving the sale (1031 exchange, divorce, estate, relocation)? That informs how much negotiation room exists.
- Schools are F-rated, which usually means shorter tenancies and higher turnover. Who's the typical renter profile here, and what's been the actual vacancy rate?
- The area grade is low — what's the realistic commute time and amenity access for the typical tenant pool here? Any planned neighborhood developments (good or bad) we should know about?
- What's the average days-on-market for RENTAL listings here right now (not sales)? A rising rental-DOM trend means longer vacancies and softer asking-rent achievability than the comps imply.
- What's the recent tenant-quality profile in this submarket — average credit score on applications, eviction rate, late-payment / NSF rate, and stable-employment percentage? A property-management company in the area should have these aggregated.
CashFlowRE · CFR-C2MW8E704ANWN0
· Data 2 days ago
cashflowre.app · 2026-05-29