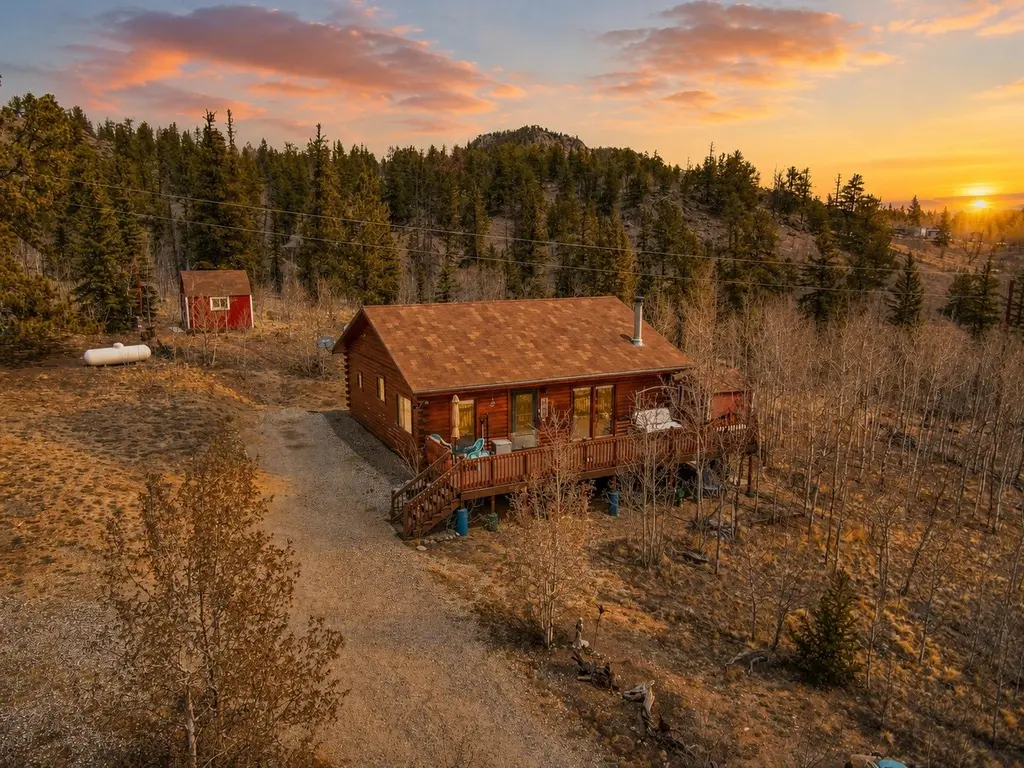
360 Musket Ln
Jefferson, CO 80432
$439,900D-
1 bd · 1.0 ba ·
960 sqft ·
Built 2006
· SingleFamily
· Active
· 38 DOM
Cashflow @ list (25.0% down · 7.5%)
Estimated rent
$3,141/mo
Mortgage (P&I)
−$2,307
Tax + insurance
−$277
HOA
−$2
Vac / Maint / Mgmt
−$660
Net cashflow
$-104/mo
Annual
$-1,248/yr
Cap rate
6.01%
Cash-on-cash
-1.01%
DSCR
0.95
1% rule
0.71%
Cash to close
$123,172
Investor read
- This is a 1-bed/1.0-bath single-family listed at $440k.
- At list price, monthly cash flow is $-104 ($-1k/yr) — negative.
- To cash-flow at today's rent, offer at most $422k (4.2% below list).
- To meet the 1% rule (rent ≥ 1% of price), the offer needs to be $314k (28.6% below list).
- It's been on market 38 days — a 3% lower offer ($427k) is reasonable based on typical stale-listing flexibility.
- Recommended offer: $314k (28.6% below list) — sets the bar for 1% rule.
- Local home prices are declining (-3.0%/yr); year-one equity from $3k of loan paydown is wiped out by about $13k of value loss. Plan a longer hold.
- Location reads: area grade D — affects rentability + tenant quality, not the cash-flow math above.
- Park County School District No. Re-2 (rural): math 25% / reading 39% proficiency, ranked #89 of 176 in CO (top 51%) — families likely to look elsewhere, expect single-tenant / working-renter base with shorter leases.
- Zoned schools: Edith Teter Elementary School (math 15% / reading 34%, grade F, #604 of 966 statewide, top 63%, 211 students, 39% FRL); South Park Middle School (math 24% / reading 44%, grade F, #106 of 270 statewide, top 42%, 98 students, 36% FRL); South Park High School (math 10% / reading 70%, grade F, #167 of 381 statewide, top 46%, 124 students, 27% FRL) — zoned schools at 34% FRL track the district average.
- Market conditions: 141 active listings in the ZIP; 1 comparable units currently listed for rent nearby; 144 units permitted in Park County in 2024 (0 in 5+ unit buildings).
- Park County population projected to shrink 7% by 2050 — rents likely to lag national; underwrite the cash flow, not the appreciation.
- 3 sale attempts with the ask held roughly flat each time — persistent listings suggest the price (not the market) is what's stuck; bring a comps-based counter.
- Current owner paid $60k; list at $440k implies a 639% gain — meaningful room to come down on a strong offer.
- Cap rate 6.0% vs local median 3.2% in Jefferson — top-decile yield for the area; either an underpriced asset or a hidden risk that comps aren't pricing in. Stress-test before assuming the spread holds.
Questions for listing agent
- What do current leases actually rent for vs. the listed asking? Can we see a recent rent roll and the last 12 months of T-12 income?
- It's been on market 38 days. Have you received any prior offers? Is the seller open to a 29% concession, seller financing, or rate buy-down credit?
- What does the HOA fee cover, when was the last increase, and are there any pending special assessments or reserve-fund shortfalls?
- Is there a deadline driving the sale (1031 exchange, divorce, estate, relocation)? That informs how much negotiation room exists.
- The area grade is low — what's the realistic commute time and amenity access for the typical tenant pool here? Any planned neighborhood developments (good or bad) we should know about?
- What's the average days-on-market for RENTAL listings here right now (not sales)? A rising rental-DOM trend means longer vacancies and softer asking-rent achievability than the comps imply.
- What's the recent tenant-quality profile in this submarket — average credit score on applications, eviction rate, late-payment / NSF rate, and stable-employment percentage? A property-management company in the area should have these aggregated.
- How much new for-sale + rental construction is in the pipeline within 1–3 miles? Heavy new supply typically softens prices + rents 12–24 months out; constrained supply supports both.
CashFlowRE · CFR-C2RZPG69WGQTBB
· Data 11 h ago
cashflowre.app · 2026-05-29