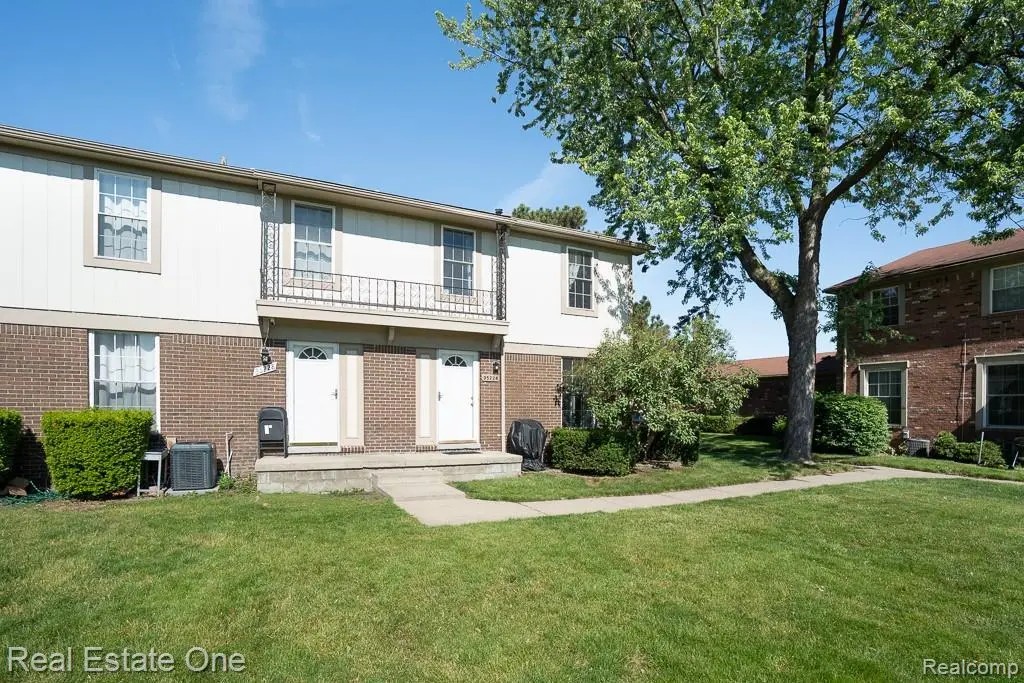
35226 Tall Oaks Dr
Sterling Heights, MI 48312
$138,000D
2 bd · 1.0 ba ·
800 sqft ·
Built 1973
· Condo
· Pending
· 12 DOM
Cashflow @ list (25.0% down · 7.5%)
Estimated rent
$1,528/mo
Mortgage (P&I)
−$724
Tax + insurance
−$230
HOA
−$261
Vac / Maint / Mgmt
−$321
Net cashflow
$-8/mo
Annual
$-95/yr
Cap rate
6.22%
Cash-on-cash
-0.25%
DSCR
0.99
1% rule
1.11%
Cash to close
$38,640
Investor read
- This is a 2-bed/1.0-bath condo listed at $138k. Condition is rated fair.
- At list price, monthly cash flow is $-8 ($-95/yr) — negative.
- To cash-flow at today's rent, offer at most $137k (0.8% below list).
- Meets the 1% rule at list price ($2k rent vs $138k).
- Only 12 days on market — expect competitive offers; lowballing is unlikely to land.
- Recommended offer: $137k (0.8% below list) — sets the bar for cash-flow.
- Local home prices are declining (-3.0%/yr); year-one equity from $954 of loan paydown is wiped out by about $4k of value loss. Plan a longer hold.
- Location reads 74/100 on livability (#173 in MI, #4,545 nationally) — a middle-class / working-renter tenant base. Strengths: commute A+, cost of living A+, housing A+; Watch: health & safety D+, amenities F.
- Warren Consolidated Schools (urban): math 18% / reading 39% proficiency, ranked #373 of 540 in MI (top 69%) — low school quality limits family demand, transient renter base, plan for 1-2y turnover.
- Zoned schools: Willow Woods Elementary School (math 17% / reading 27%, grade F, #1,035 of 1,397 statewide, top 77%, 328 students, 81% FRL); Carleton Middle School (math 15% / reading 37%, grade F, #383 of 493 statewide, top 78%, 659 students, 76% FRL); Sterling Heights Senior Hs (math 17% / reading 47%, grade F, #405 of 713 statewide, top 59%, 1,389 students, 76% FRL) — zoned schools average 78% FRL vs 48% district-wide (29 pts higher); higher-poverty schools than district average — tighter screening recommended.
- Market conditions: 163 active listings in the ZIP; 6 comparable units currently listed for rent nearby; rentals at typical pace (median 17d on market — plan ~3-4 weeks tenant-placement turnaround); 1,321 units permitted in Macomb County in 2024 (86 in 5+ unit buildings).
- Macomb County population projected at +9% by 2050 — modest demand growth; plan on rents tracking national, not racing it.
- 2 sale attempts with the ask held roughly flat each time — persistent listings suggest the price (not the market) is what's stuck; bring a comps-based counter.
- Cap rate 6.2% vs local median 3.8% in Sterling Heights — top-decile yield for the area; either an underpriced asset or a hidden risk that comps aren't pricing in. Stress-test before assuming the spread holds.
Questions for listing agent
- What do current leases actually rent for vs. the listed asking? Can we see a recent rent roll and the last 12 months of T-12 income?
- Have any recent inspections been done? Can we get a copy of the seller's disclosures and any deferred-maintenance estimates?
- Built in 1973 — when were the roof, HVAC, electrical panel, plumbing, and water heater last replaced?
- What does the HOA fee cover, when was the last increase, and are there any pending special assessments or reserve-fund shortfalls?
- Any open or pending special assessments — roof, HVAC, plumbing, elevator, façade? What's the per-unit balance and payoff schedule, and is the seller paying it off at close or rolling it to the buyer?
- Is there a deadline driving the sale (1031 exchange, divorce, estate, relocation)? That informs how much negotiation room exists.
- The area grade is low — what's the realistic commute time and amenity access for the typical tenant pool here? Any planned neighborhood developments (good or bad) we should know about?
- What's the average days-on-market for RENTAL listings here right now (not sales)? A rising rental-DOM trend means longer vacancies and softer asking-rent achievability than the comps imply.
Repairs flagged (vision-AI assessment)
- Moderate: Kitchen cabinets — Worn appearance
- Moderate: Paint — Faded in some areas
- Moderate: Exterior siding — Weathered appearance
CashFlowRE · CFR-C2T6YT9YC2ZCVD
· Data 1 week ago
cashflowre.app · 2026-05-29