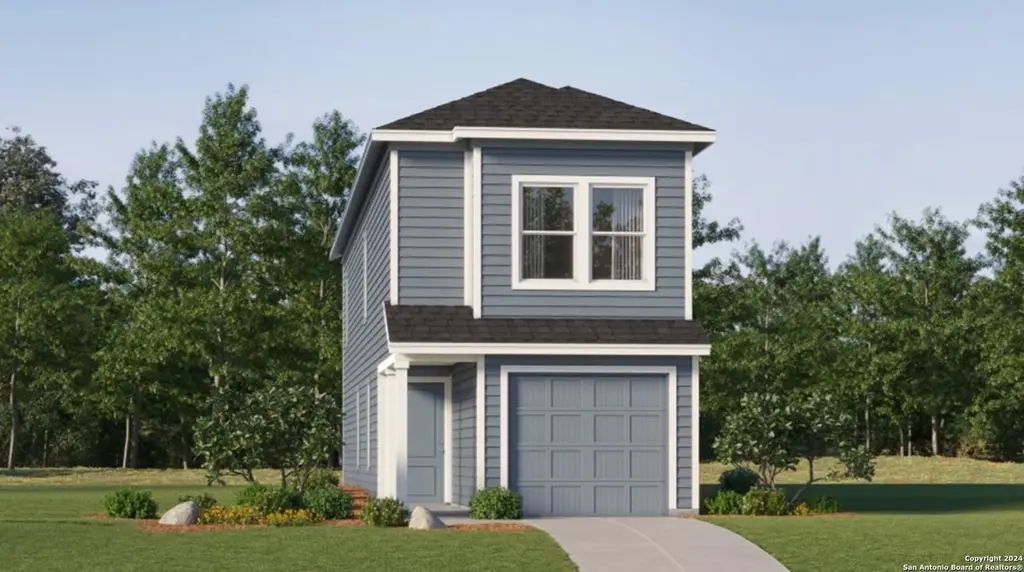
7643 Varo Gln
San Antonio, TX 78263
$154,499D
4 bd · 2.5 ba ·
1,535 sqft ·
Built 2026
· SingleFamily
· Pending
· 51 DOM
Cashflow @ list (25.0% down · 7.5%)
Estimated rent
$1,461/mo
Mortgage (P&I)
−$810
Tax + insurance
−$257
HOA
−$106
Vac / Maint / Mgmt
−$307
Net cashflow
$-20/mo
Annual
$-238/yr
Cap rate
6.14%
Cash-on-cash
-0.55%
DSCR
0.98
1% rule
0.95%
Cash to close
$43,260
Investor read
- This is a 4-bed/2.5-bath single-family listed at $154k. Condition is rated excellent.
- At list price, monthly cash flow is $-20 ($-238/yr) — negative.
- To cash-flow at today's rent, offer at most $152k (1.9% below list).
- To meet the 1% rule (rent ≥ 1% of price), the offer needs to be $146k (5.5% below list).
- It's been on market 51 days — a 3% lower offer ($150k) is reasonable based on typical stale-listing flexibility.
- Recommended offer: $146k (5.5% below list) — sets the bar for 1% rule.
- Local home prices are declining (-3.0%/yr); year-one equity from $1k of loan paydown is wiped out by about $5k of value loss. Plan a longer hold.
- Location reads 80/100 on livability (#31 in TX, #1,616 nationally) — a professional / high-income tenant draw. Strengths: amenities A+, commute A+, cost of living A+; Watch: schools C-, crime F.
- East Central ISD (rural): math 16% / reading 25% proficiency, ranked #758 of 826 in TX (top 92%) — low school quality limits family demand, transient renter base, plan for 1-2y turnover; 61% free/reduced lunch — lower-income household profile, screen leases tightly.
- Market conditions: 277 active listings in the ZIP; 6 comparable units currently listed for rent nearby; rentals lingering (median 44d on market — plan ~5-8 weeks vacancy on turnover, expect pricing pressure); 67% of comp listings sitting > 30 days — soft ceiling on asking rent; 8,308 units permitted in Bexar County in 2024 (2,506 in 5+ unit buildings).
- Bexar County population projected at +50% by 2050 — long-run rental-demand tailwind backs the buy-and-hold thesis.
- Cap rate 6.1% vs local median 3.8% in San Antonio — top-decile yield for the area; either an underpriced asset or a hidden risk that comps aren't pricing in. Stress-test before assuming the spread holds.
Questions for listing agent
- What do current leases actually rent for vs. the listed asking? Can we see a recent rent roll and the last 12 months of T-12 income?
- It's been on market 51 days. Have you received any prior offers? Is the seller open to a 5% concession, seller financing, or rate buy-down credit?
- What does the HOA fee cover, when was the last increase, and are there any pending special assessments or reserve-fund shortfalls?
- Is there a deadline driving the sale (1031 exchange, divorce, estate, relocation)? That informs how much negotiation room exists.
- Crime grade is F in this area — have there been break-ins, vandalism, or insurance claims at this property in the last 3 years? What carrier currently insures it and at what premium?
- The area grade is low — what's the realistic commute time and amenity access for the typical tenant pool here? Any planned neighborhood developments (good or bad) we should know about?
- What's the average days-on-market for RENTAL listings here right now (not sales)? A rising rental-DOM trend means longer vacancies and softer asking-rent achievability than the comps imply.
- What's the recent tenant-quality profile in this submarket — average credit score on applications, eviction rate, late-payment / NSF rate, and stable-employment percentage? A property-management company in the area should have these aggregated.
CashFlowRE · CFR-C32AQR6F2XG3P0
· Data 1 week ago
cashflowre.app · 2026-05-29