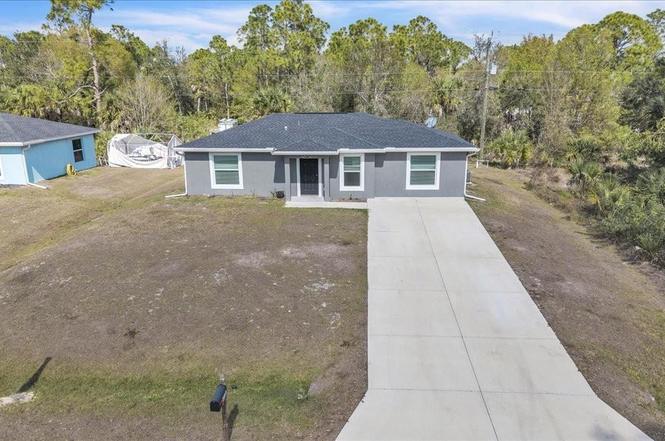
26216 Flower Rd
Punta Gorda, FL 33955
$240,000D
3 bd · 2.0 ba ·
1,228 sqft ·
Built 2024
· Land
· Pending
· 73 DOM
Cashflow @ list (25.0% down · 7.5%)
Estimated rent
$2,189/mo
Mortgage (P&I)
−$1,259
Tax + insurance
−$474
HOA
−$0
Vac / Maint / Mgmt
−$460
Net cashflow
$-3/mo
Annual
$-40/yr
Cap rate
6.61%
Cash-on-cash
1.13%
DSCR
1.05
1% rule
0.91%
Cash to close
$67,200
Investor read
- This is a 3-bed/2.0-bath land listed at $240k.
- At list price, monthly cash flow is $-3 ($-40/yr) — negative.
- To cash-flow at today's rent, offer at most $239k (0.2% below list).
- To meet the 1% rule (rent ≥ 1% of price), the offer needs to be $219k (8.8% below list).
- It's been on market 73 days — a 6% lower offer ($226k) is reasonable based on typical stale-listing flexibility.
- Recommended offer: $219k (8.8% below list) — sets the bar for 1% rule.
- Local home prices are declining (-3.0%/yr); year-one equity from $2k of loan paydown is wiped out by about $7k of value loss. Plan a longer hold.
- Location reads 76/100 on livability (#225 in FL, #3,567 nationally) — a middle-class / working-renter tenant base. Strengths: schools A+, crime A+, health & safety A+; Watch: cost of living D+, amenities D-, commute F.
- Charlotte (suburban): math 54% / reading 54% proficiency, ranked #22 of 73 in FL (top 30%) — acceptable for families but not a draw, mixed tenant base, ~2y average lease.
- Watch-outs: flood insurance adds $66/mo.
- Market conditions: 1481 active listings in the ZIP; 4 comparable units currently listed for rent nearby; rentals at typical pace (median 21d on market — plan ~3-4 weeks tenant-placement turnaround); solid renter incomes; 4,585 units permitted in Charlotte County in 2024 (703 in 5+ unit buildings).
- Charlotte County population projected at +24% by 2050 — long-run rental-demand tailwind backs the buy-and-hold thesis.
- 4 sale attempts since 7y ago with the ask held roughly flat each time — persistent listings suggest the price (not the market) is what's stuck; bring a comps-based counter.
- Climate carrying-cost: severe flood risk; severe wind risk, 99% chance of damaging wind over 30y; extreme-heat days projected 7→27/yr by 2055 (HVAC capex compounding) — expect insurance premiums to compound above CPI over the hold.
- Cap rate 6.6% vs local median 2.8% in Punta Gorda — top-decile yield for the area; either an underpriced asset or a hidden risk that comps aren't pricing in. Stress-test before assuming the spread holds.
- This rent runs 34% of the median local income ($77k/yr) — at the standard rent-burdened threshold; future hikes will face affordability resistance.
Questions for listing agent
- What do current leases actually rent for vs. the listed asking? Can we see a recent rent roll and the last 12 months of T-12 income?
- It's been on market 73 days. Have you received any prior offers? Is the seller open to a 9% concession, seller financing, or rate buy-down credit?
- What's the actual annual flood-insurance premium (NFIP or private), and is the property in a SFHA with mandatory coverage?
- Why hasn't it sold? Are there any deal-killer items the seller is aware of (foundation, flood, title, zoning, code violations)?
- Is there a deadline driving the sale (1031 exchange, divorce, estate, relocation)? That informs how much negotiation room exists.
- Schools are A-rated — typically a magnet for longer-tenancy family renters. What's the average tenant stay here, and is there a school-zone premium baked into asking?
- The area grade is low — what's the realistic commute time and amenity access for the typical tenant pool here? Any planned neighborhood developments (good or bad) we should know about?
- What's the average days-on-market for RENTAL listings here right now (not sales)? A rising rental-DOM trend means longer vacancies and softer asking-rent achievability than the comps imply.
CashFlowRE · CFR-C7AWV6BA2KSQMW
· Data 6 days ago
cashflowre.app · 2026-05-29